 2
2peptides
spectra
0.334 | 0.632
0.000 | 0.000
0.000 | 0.183
0.000 | 0.464
0.000 | 0.137
0.000 | 0.460
0.000 | 0.053
0.000 | 0.058
| Plot | Mito | Lyso | Perox | ER | Golgi | PM | Cytosol | Nucleus | |||||
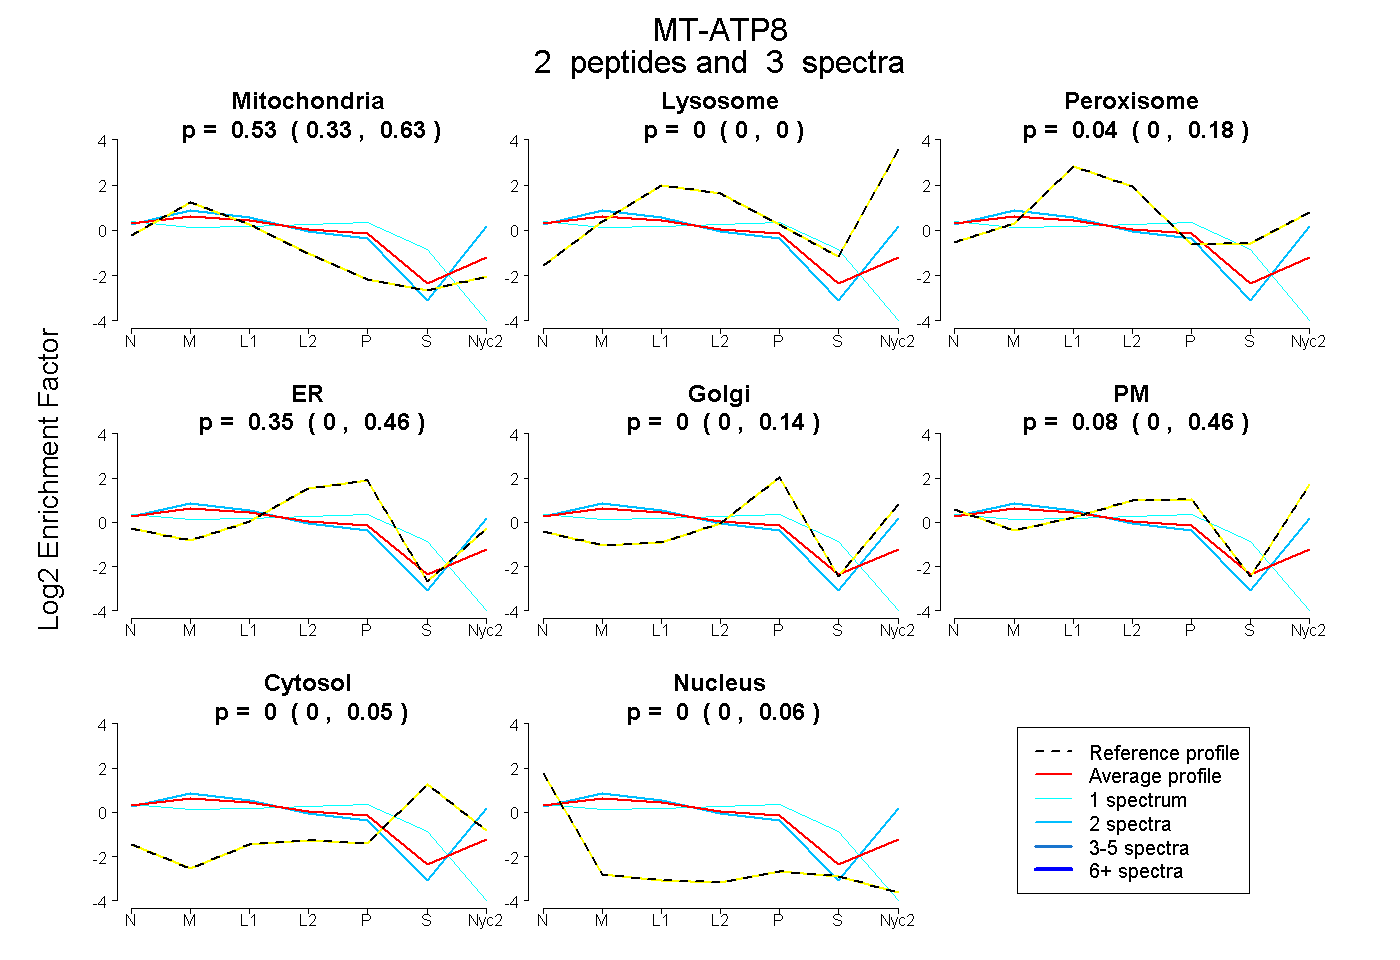
| Expt A |
2 peptides |
3 spectra |
|
0.531 0.334 | 0.632 |
0.000 0.000 | 0.000 |
0.036 0.000 | 0.183 |
0.352 0.000 | 0.464 |
0.000 0.000 | 0.137 |
0.081 0.000 | 0.460 |
0.000 0.000 | 0.053 |
0.000 0.000 | 0.058 |
| 2 spectra, TNNPWESK | 0.468 | 0.024 | 0.000 | 0.000 | 0.000 | 0.508 | 0.000 | 0.000 | ||
| 1 spectrum, ISSQTFPAPPSPK | 0.437 | 0.000 | 0.000 | 0.368 | 0.000 | 0.000 | 0.103 | 0.093 |
| Plot | Lyso | Other | |||||||||||
| Expt C |
2 peptides |
67 spectra |
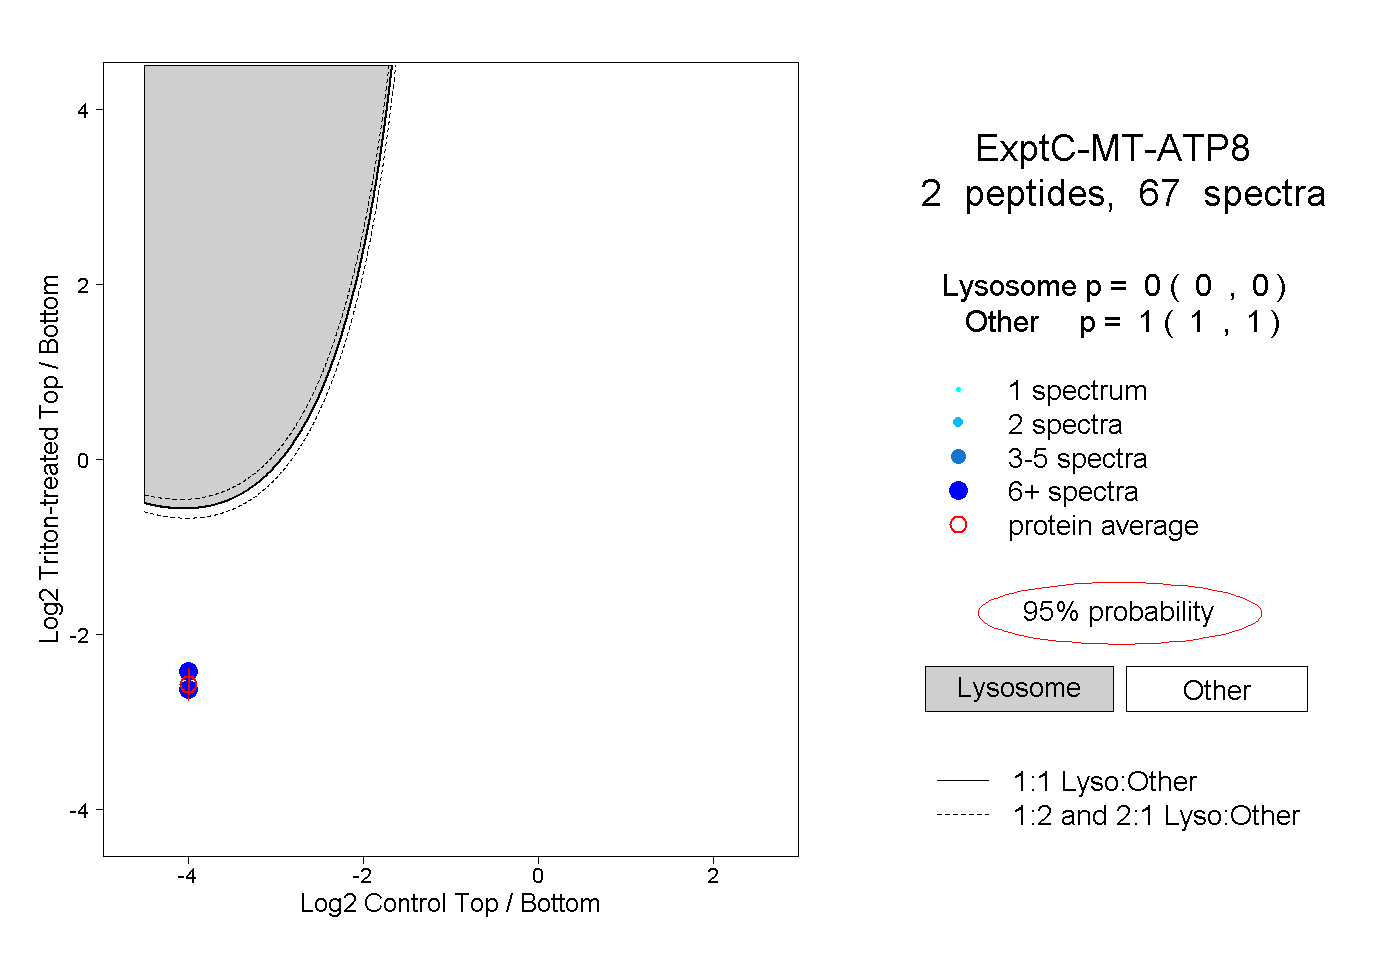 |
0.000 0.000 | 0.000 |
1.000 1.000 | 1.000 |
||||||||
| Plot | Lyso | Other | |||||||||||
| Expt D |
2 peptides |
2 spectra |
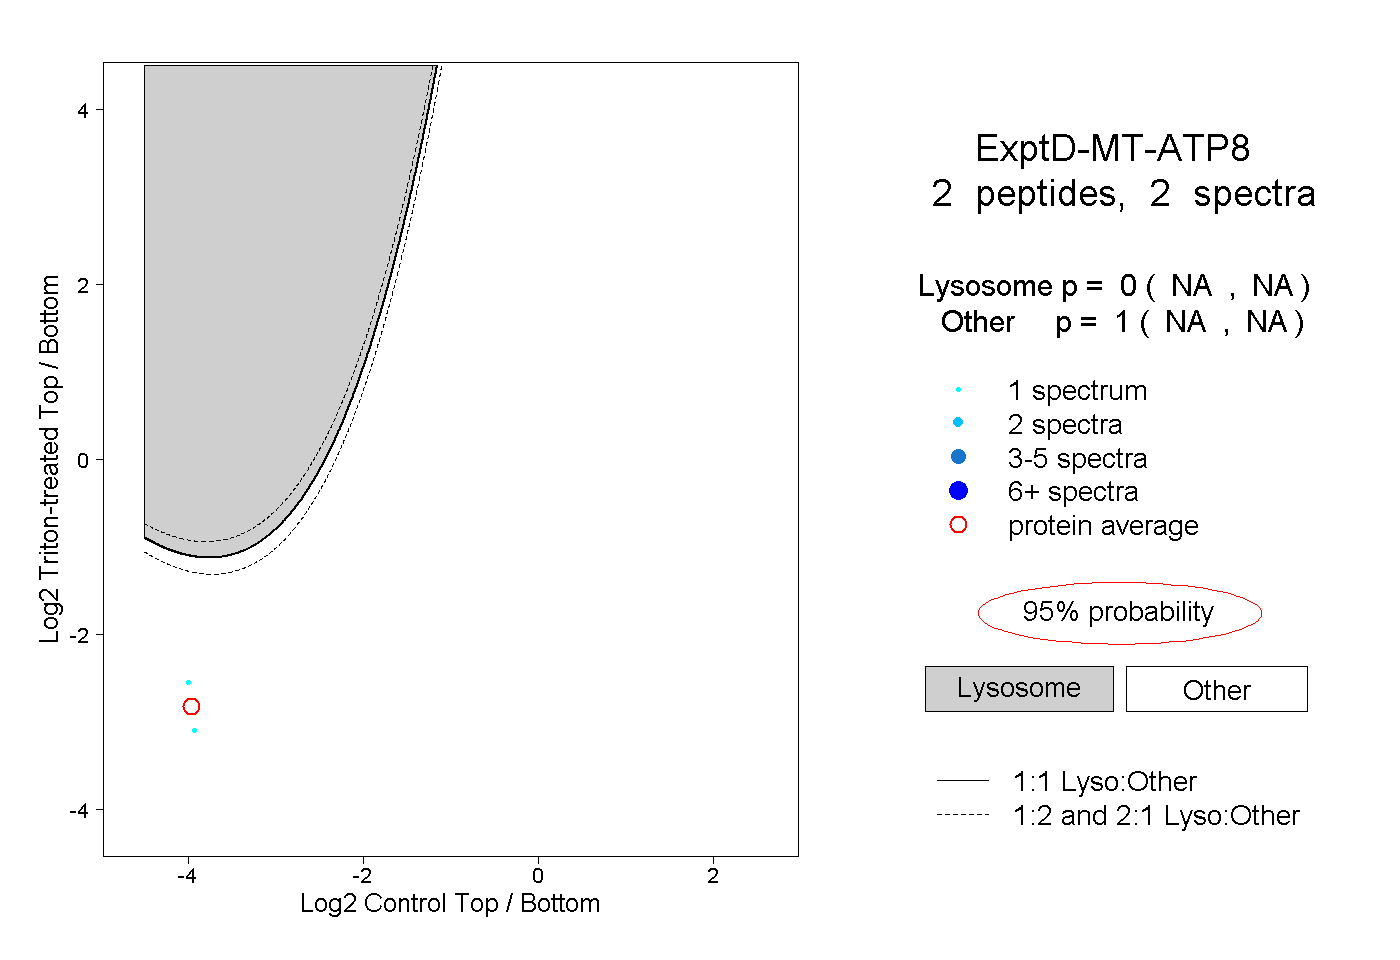 |
0.000 NA | NA |
1.000 NA | NA |