 10
10peptides
spectra
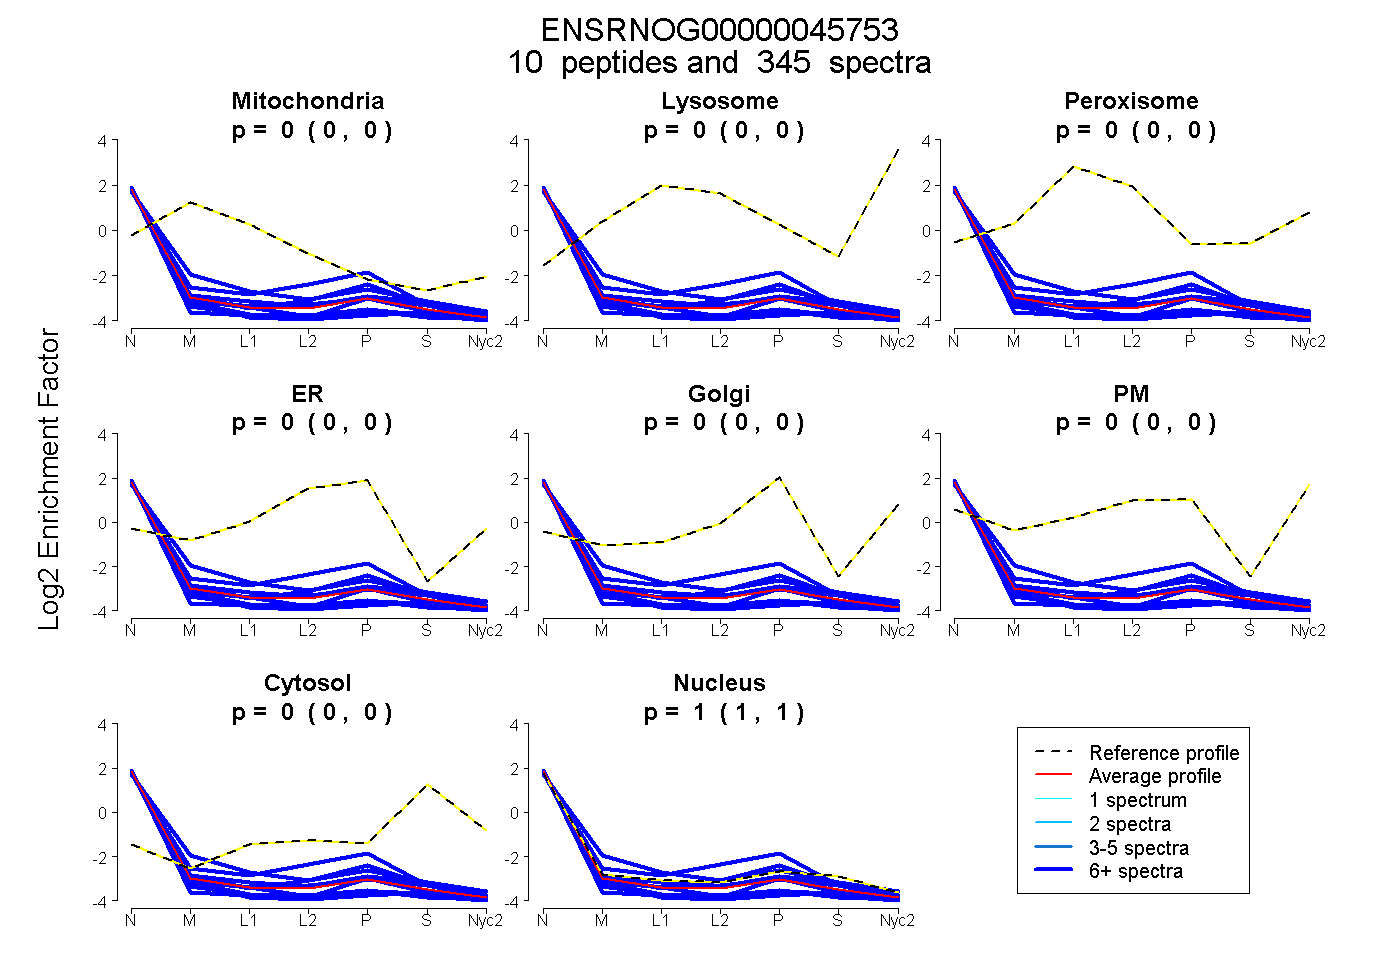
0.000 | 0.000
0.000 | 0.000
0.000 | 0.000
0.000 | 0.000
0.000 | 0.000
0.000 | 0.000
0.000 | 0.000
1.000 | 1.000
8peptides
spectra
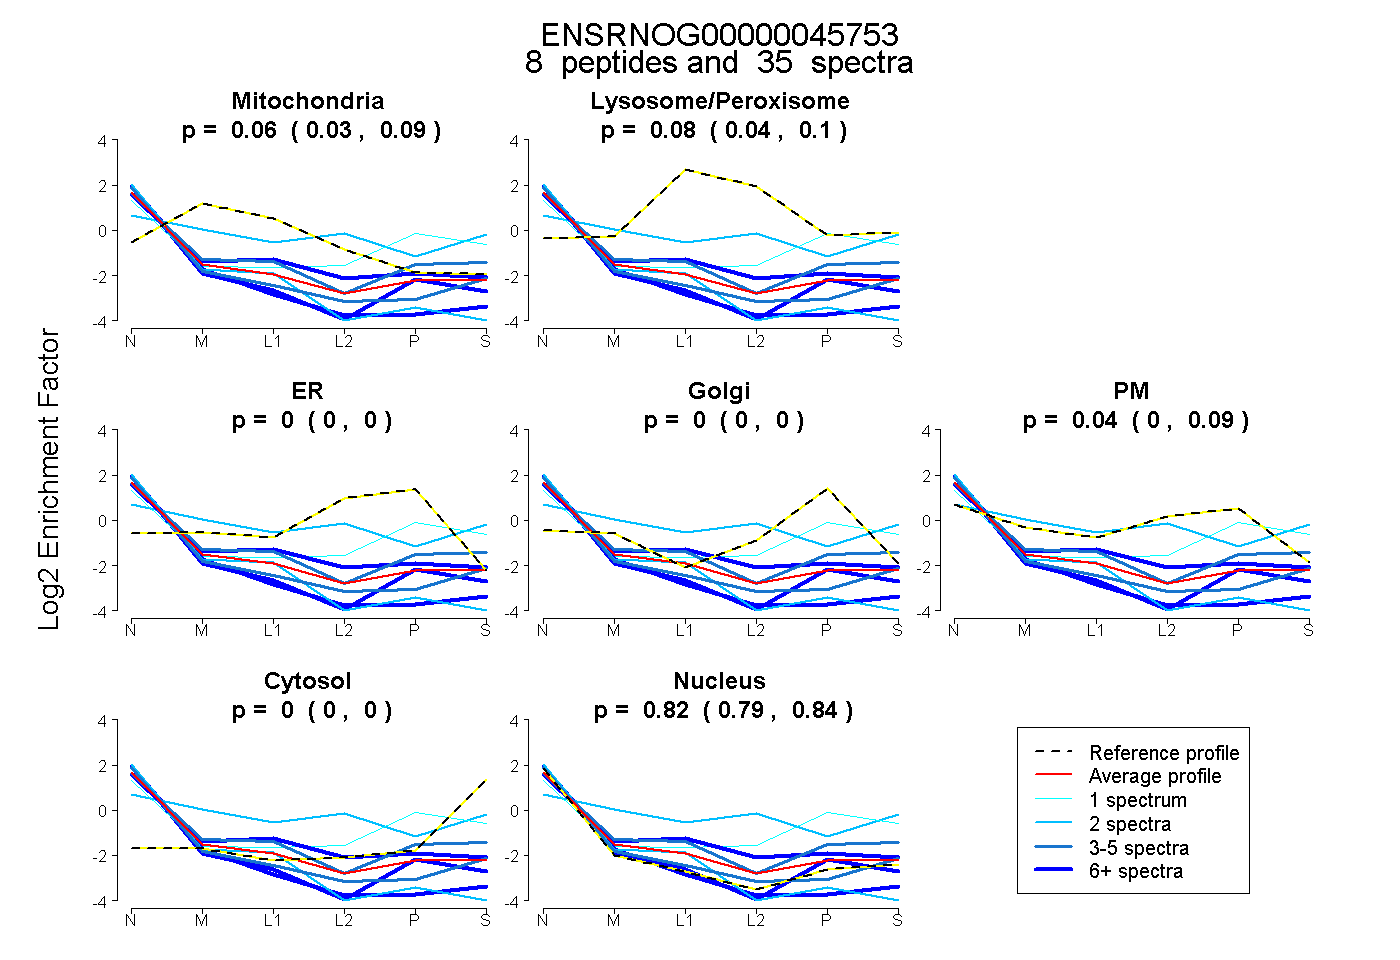
0.031 | 0.088
0.041 | 0.104
0.000 | 0.000
0.000 | 0.000
0.000 | 0.088
0.000 | 0.000
0.793 | 0.838
1peptide
spectra
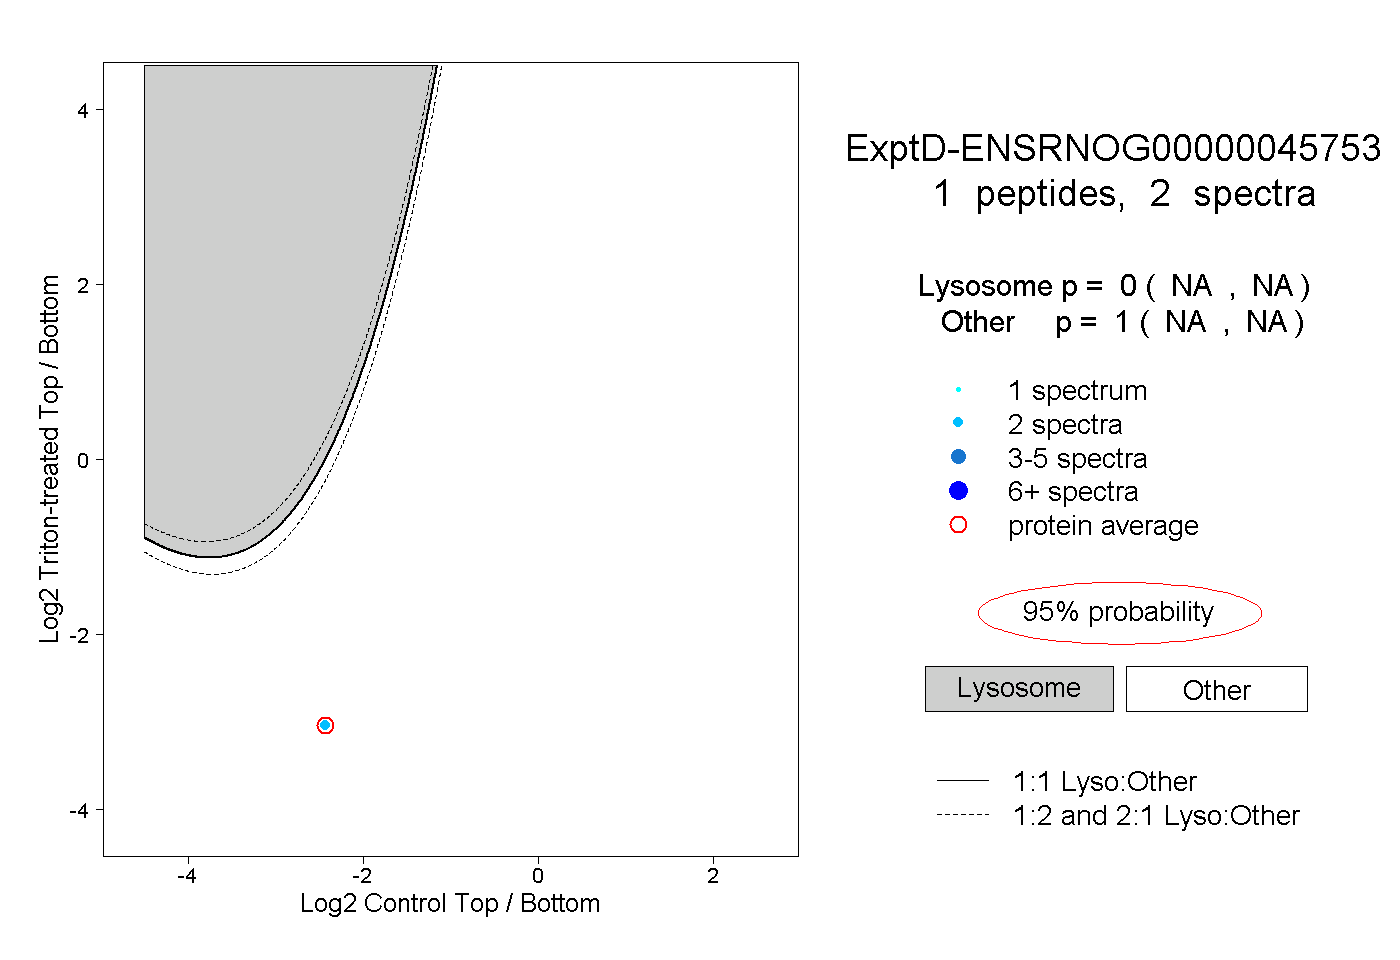
NA | NA
NA | NA