 10
10peptides
spectra
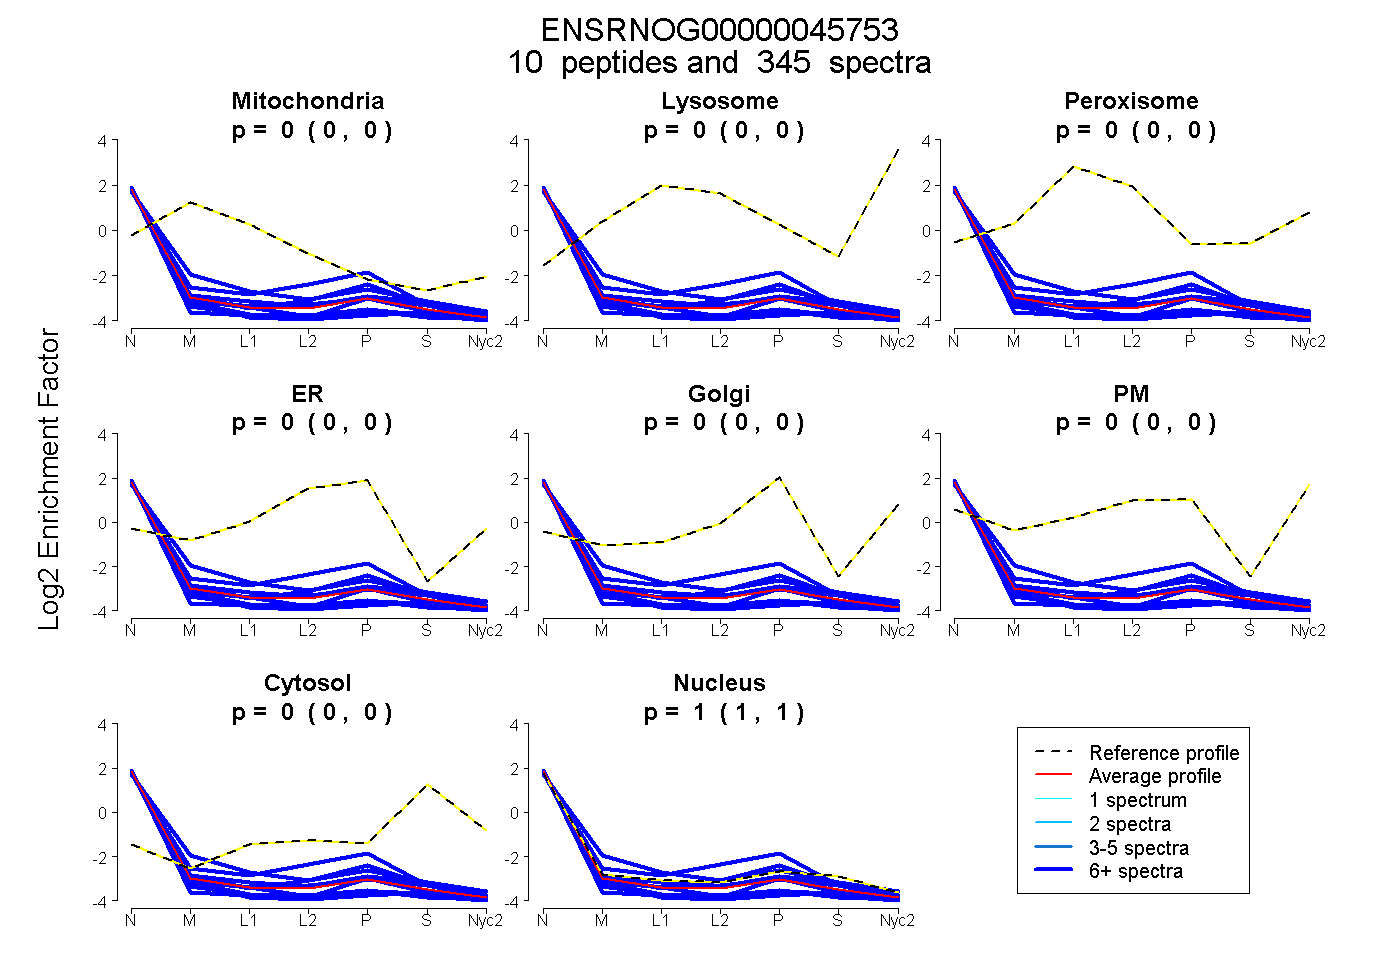
0.000 | 0.000
0.000 | 0.000
0.000 | 0.000
0.000 | 0.000
0.000 | 0.000
0.000 | 0.000
0.000 | 0.000
1.000 | 1.000
| Plot | Mito | Lyso | Perox | ER | Golgi | PM | Cytosol | Nucleus | |||||
| Expt A |
10 peptides |
345 spectra |
|
0.000 0.000 | 0.000 |
0.000 0.000 | 0.000 |
0.000 0.000 | 0.000 |
0.000 0.000 | 0.000 |
0.000 0.000 | 0.000 |
0.000 0.000 | 0.000 |
0.000 0.000 | 0.000 |
1.000 1.000 | 1.000 |
| 56 spectra, SAPAPK | 0.000 | 0.000 | 0.000 | 0.000 | 0.000 | 0.000 | 0.000 | 1.000 | ||
| 53 spectra, LLLPGELAK | 0.000 | 0.000 | 0.000 | 0.000 | 0.000 | 0.000 | 0.000 | 1.000 | ||
| 23 spectra, AMGIMNSFVNDIFER | 0.000 | 0.000 | 0.000 | 0.000 | 0.000 | 0.000 | 0.000 | 1.000 | ||
| 41 spectra, HAVSEGTK | 0.000 | 0.000 | 0.000 | 0.109 | 0.000 | 0.000 | 0.000 | 0.891 | ||
| 38 spectra, STLTSR | 0.000 | 0.000 | 0.000 | 0.000 | 0.000 | 0.000 | 0.000 | 1.000 | ||
| 11 spectra, LAHYNK | 0.000 | 0.000 | 0.000 | 0.000 | 0.000 | 0.000 | 0.000 | 1.000 | ||
| 16 spectra, QVHPDTGISSK | 0.129 | 0.000 | 0.000 | 0.000 | 0.000 | 0.000 | 0.000 | 0.871 | ||
| 17 spectra, ESYSVYVYK | 0.000 | 0.000 | 0.000 | 0.000 | 0.000 | 0.000 | 0.000 | 1.000 | ||
| 56 spectra, EIQTAVR | 0.000 | 0.000 | 0.000 | 0.000 | 0.000 | 0.000 | 0.000 | 1.000 | ||
| 34 spectra, IAGEASR | 0.000 | 0.000 | 0.000 | 0.000 | 0.000 | 0.000 | 0.000 | 1.000 |
| Plot | Mito | Lyso or Perox | ER | Golgi | PM | Cytosol | Nucleus | ||||||
| Expt B |
8 peptides |
35 spectra |
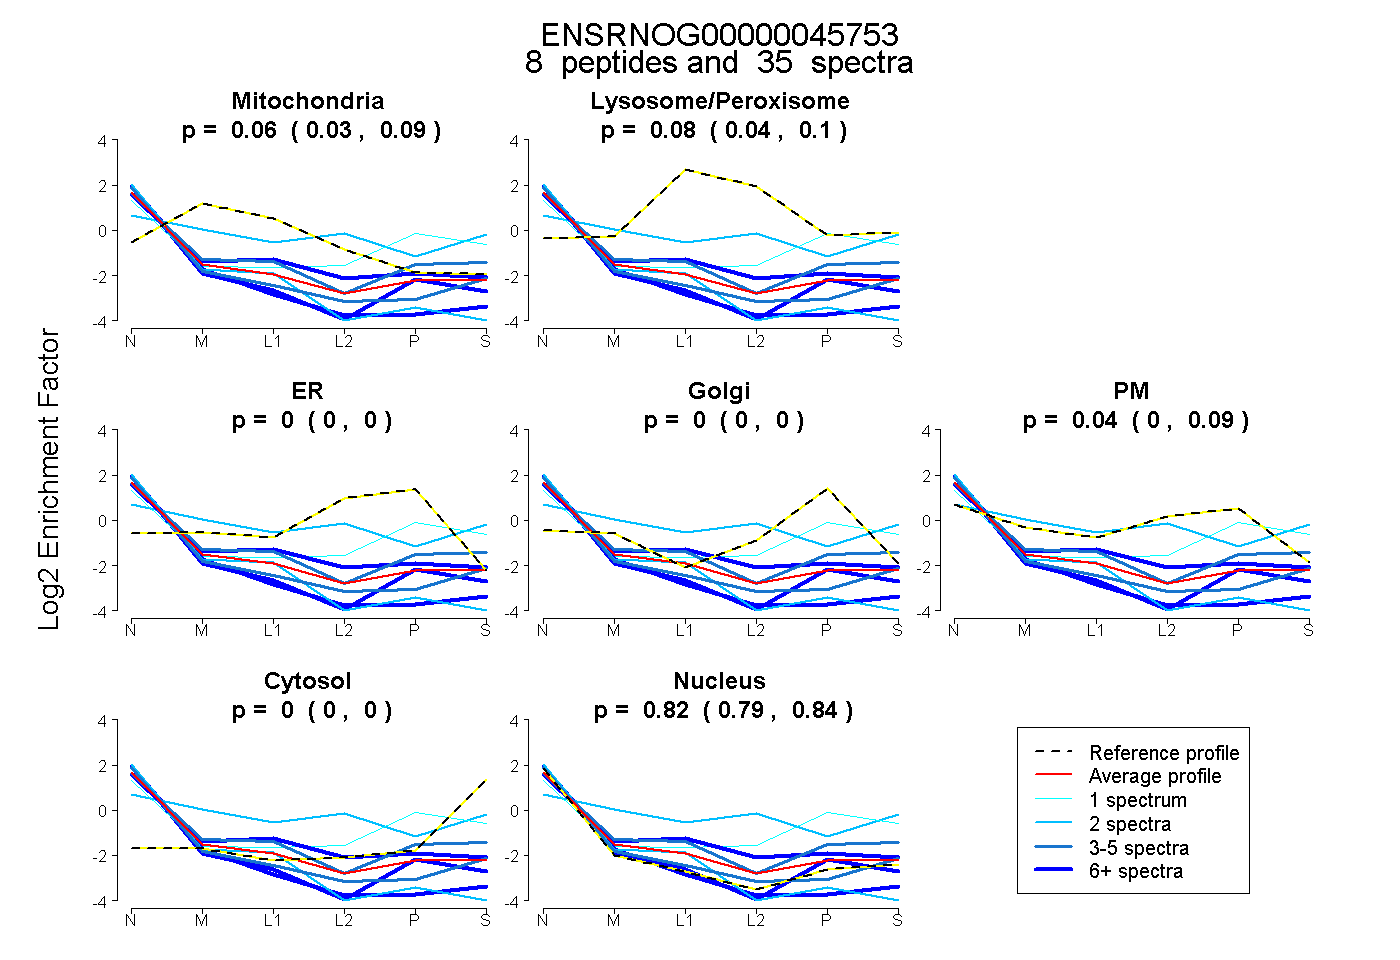 |
0.061 0.031 | 0.088 |
0.077 0.041 | 0.104 |
0.000 0.000 | 0.000 |
0.000 0.000 | 0.000 |
0.043 0.000 | 0.088 |
0.000 0.000 | 0.000 |
0.819 0.793 | 0.838 |
|||
| Plot | Lyso | Other | |||||||||||
| Expt D |
1 peptide |
2 spectra |
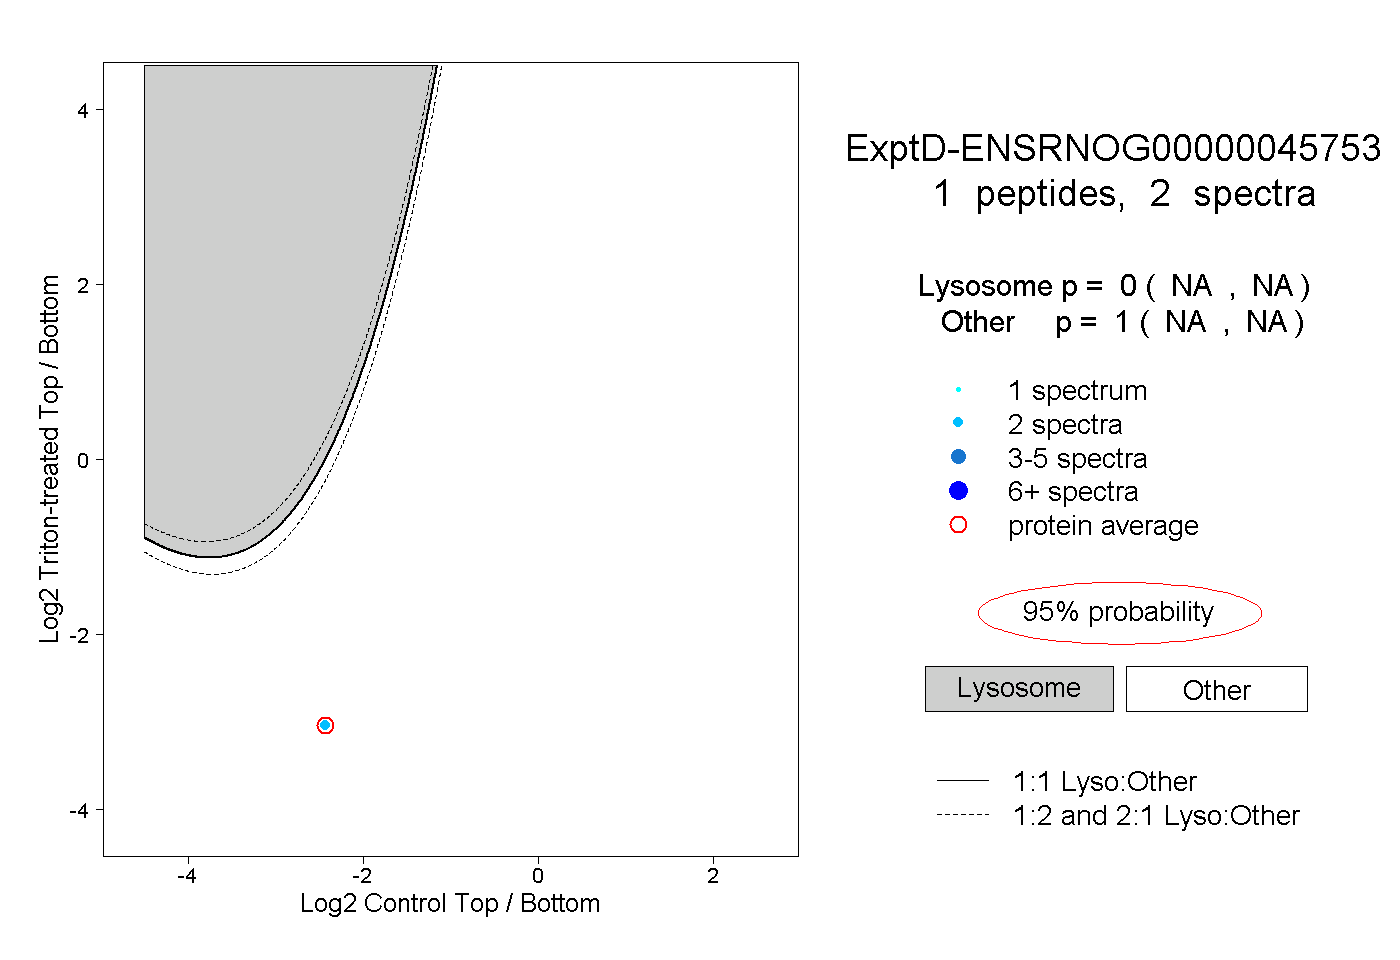 |
0.000 NA | NA |
1.000 NA | NA |