 130
130peptides
spectra
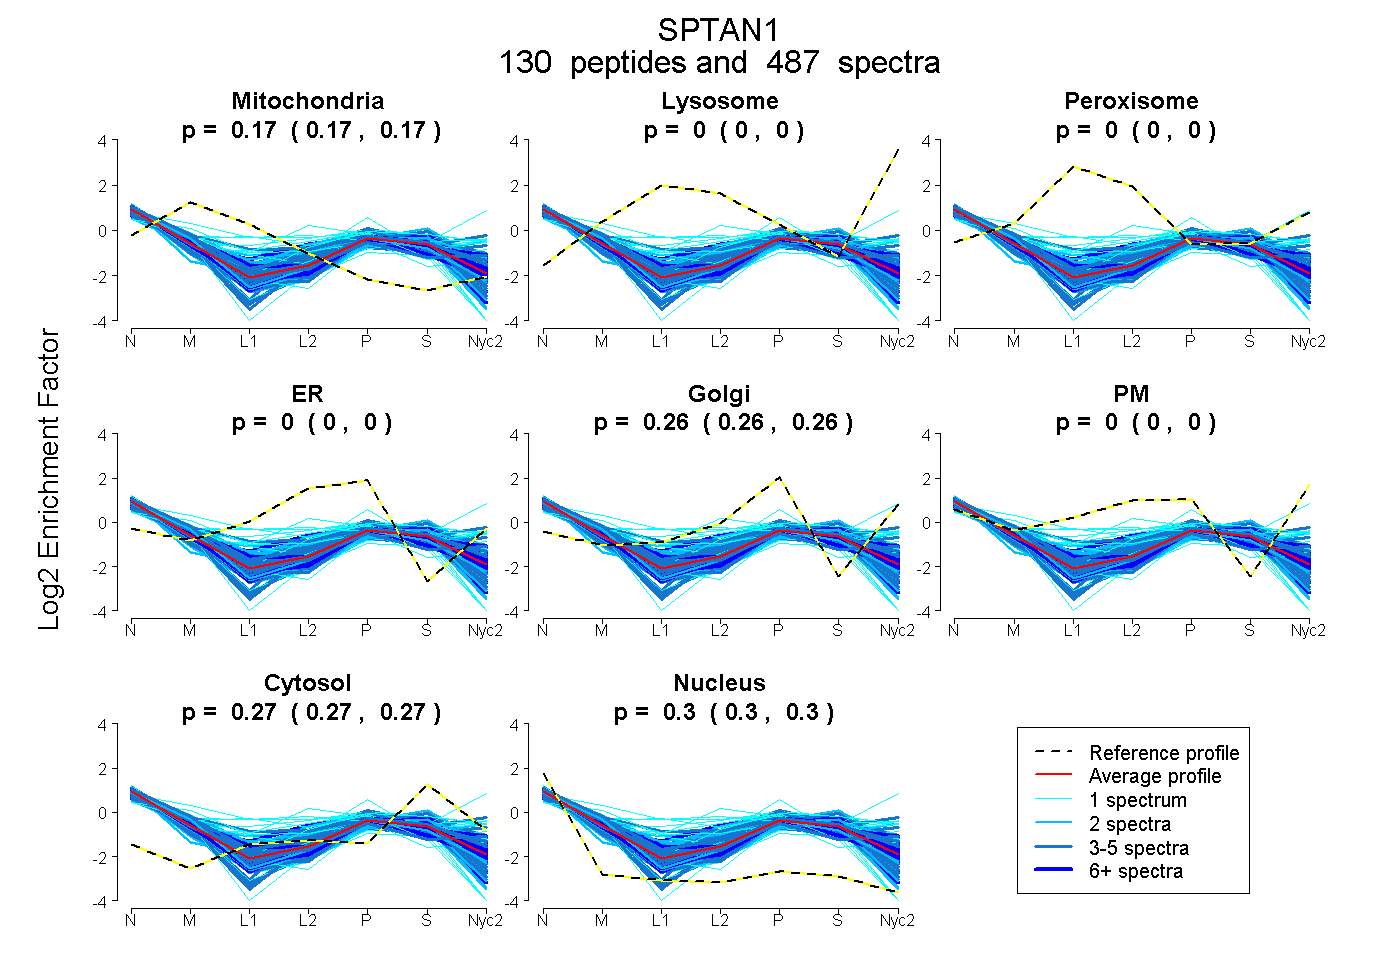
0.169 | 0.170
0.000 | 0.000
0.000 | 0.000
0.000 | 0.000
0.256 | 0.257
0.000 | 0.000
0.269 | 0.270
0.303 | 0.304
45peptides
spectra
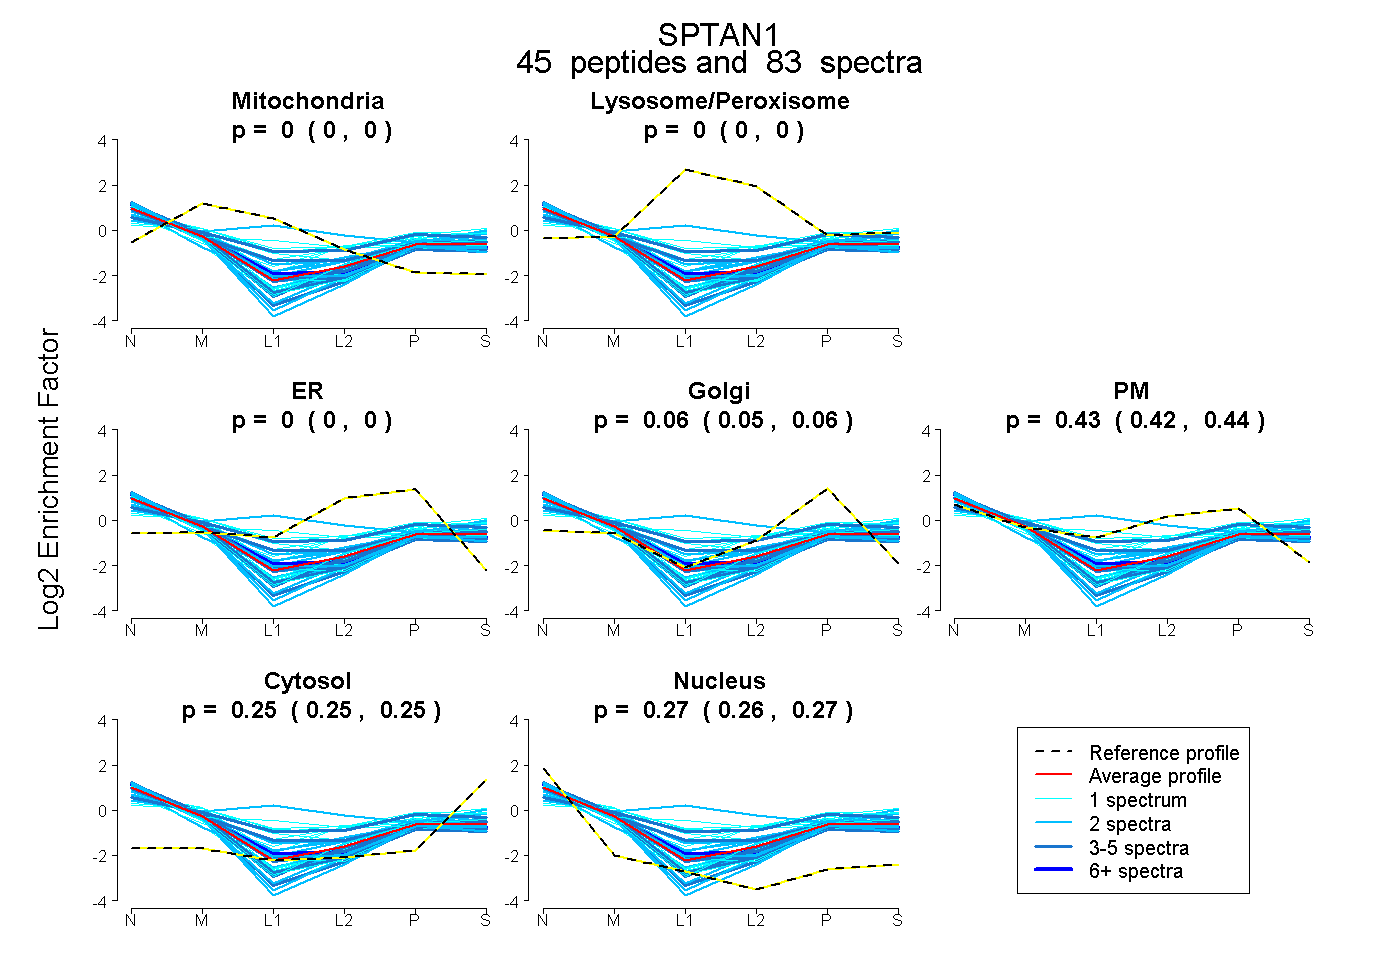
0.000 | 0.000
0.000 | 0.000
0.000 | 0.000
0.047 | 0.063
0.421 | 0.438
0.246 | 0.250
0.263 | 0.268
89peptides
spectra
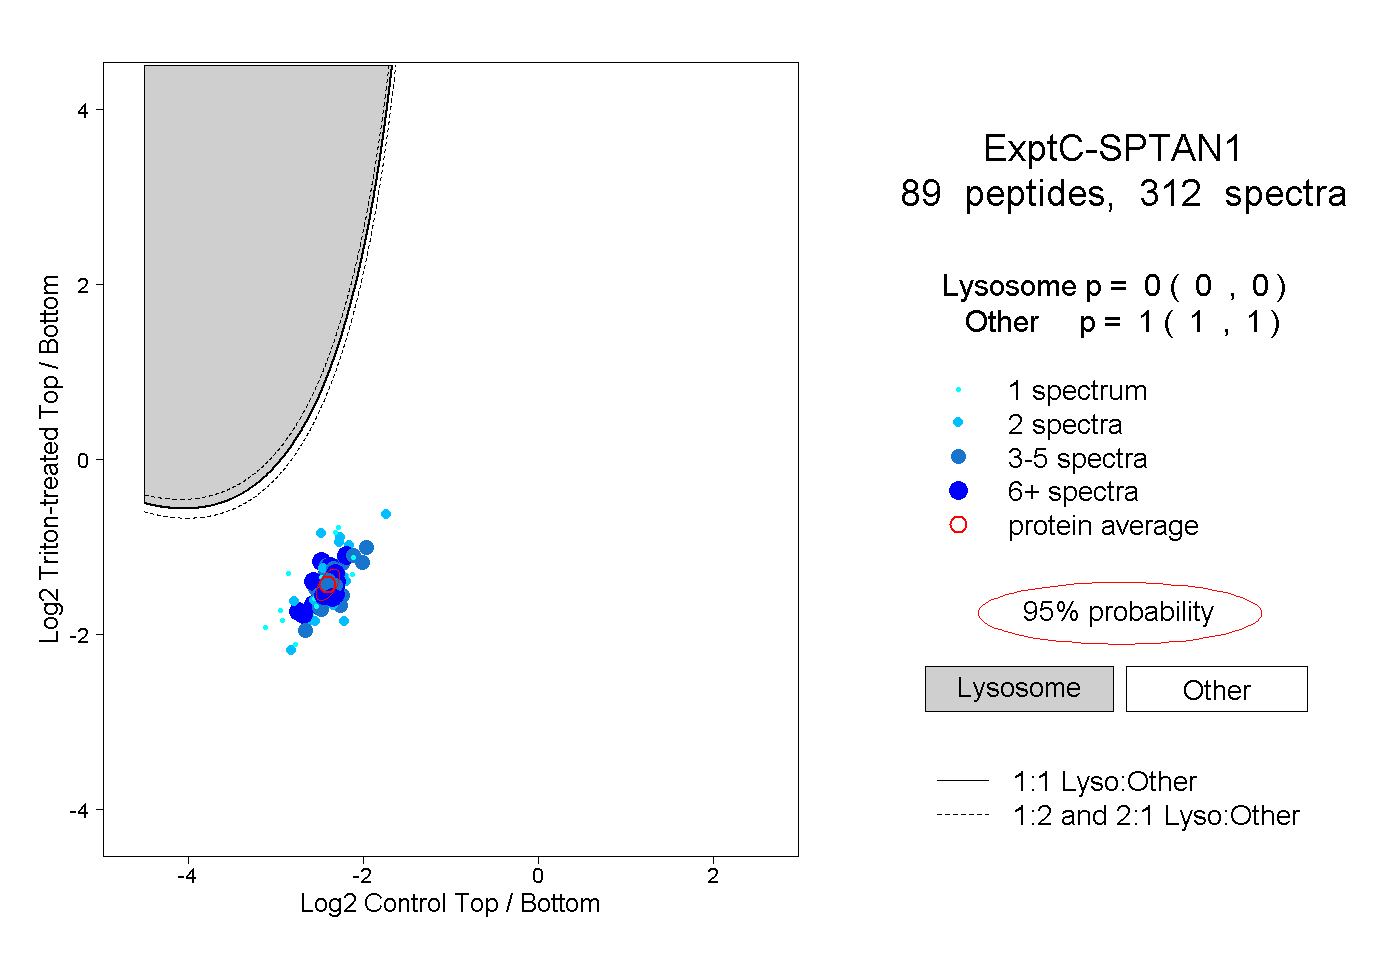
0.000 | 0.000
1.000 | 1.000
23peptides
spectra
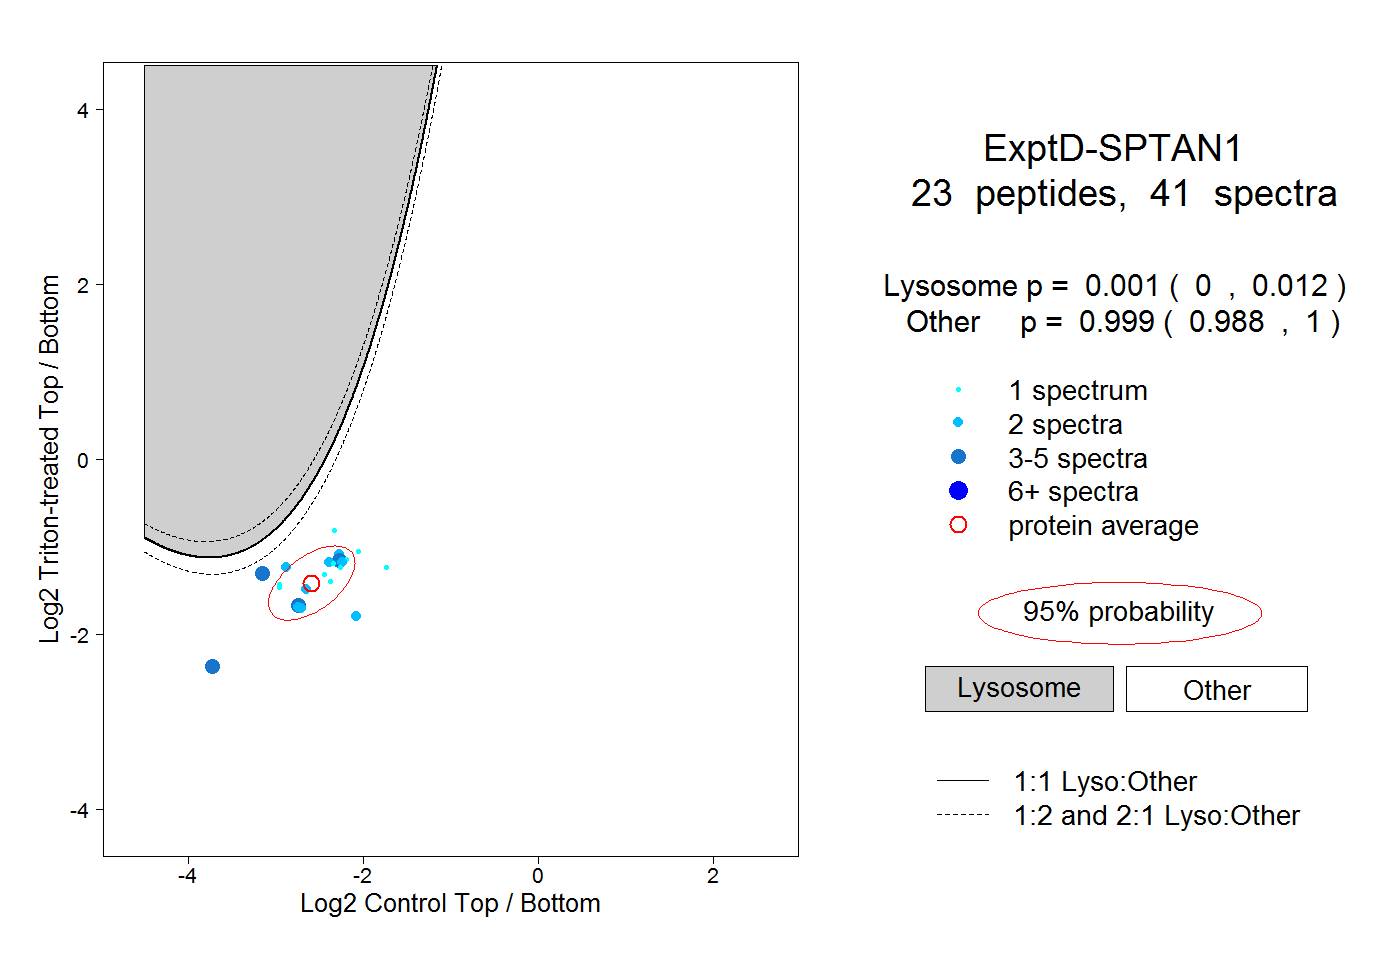
0.000 | 0.012
0.988 | 1.000