 8
8peptides
spectra
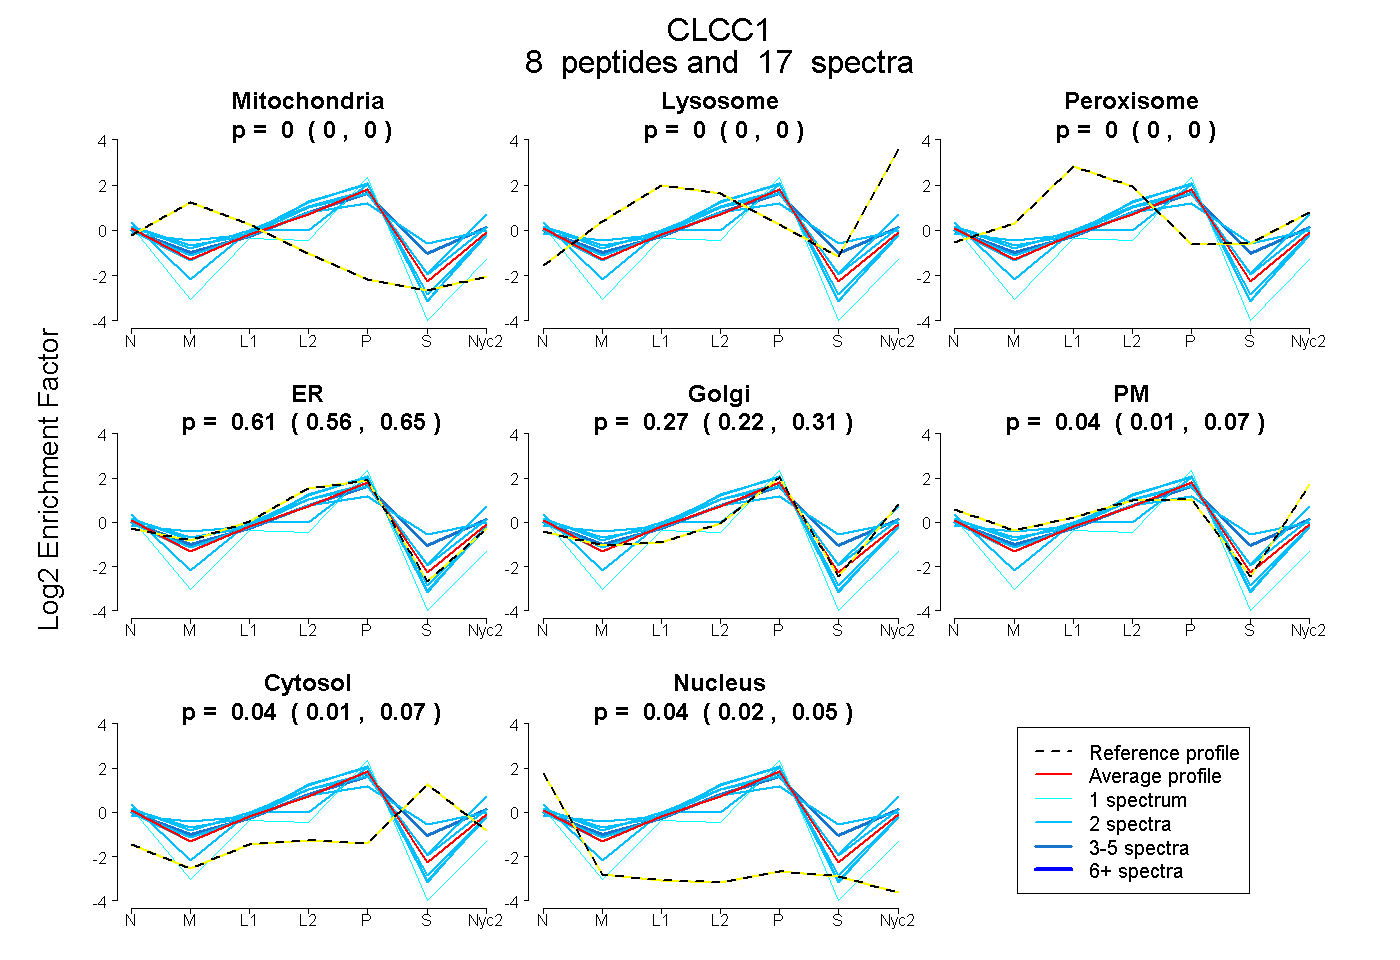
0.000 | 0.000
0.000 | 0.000
0.000 | 0.001
0.562 | 0.648
0.219 | 0.309
0.006 | 0.068
0.005 | 0.072
0.021 | 0.055
2peptides
spectra
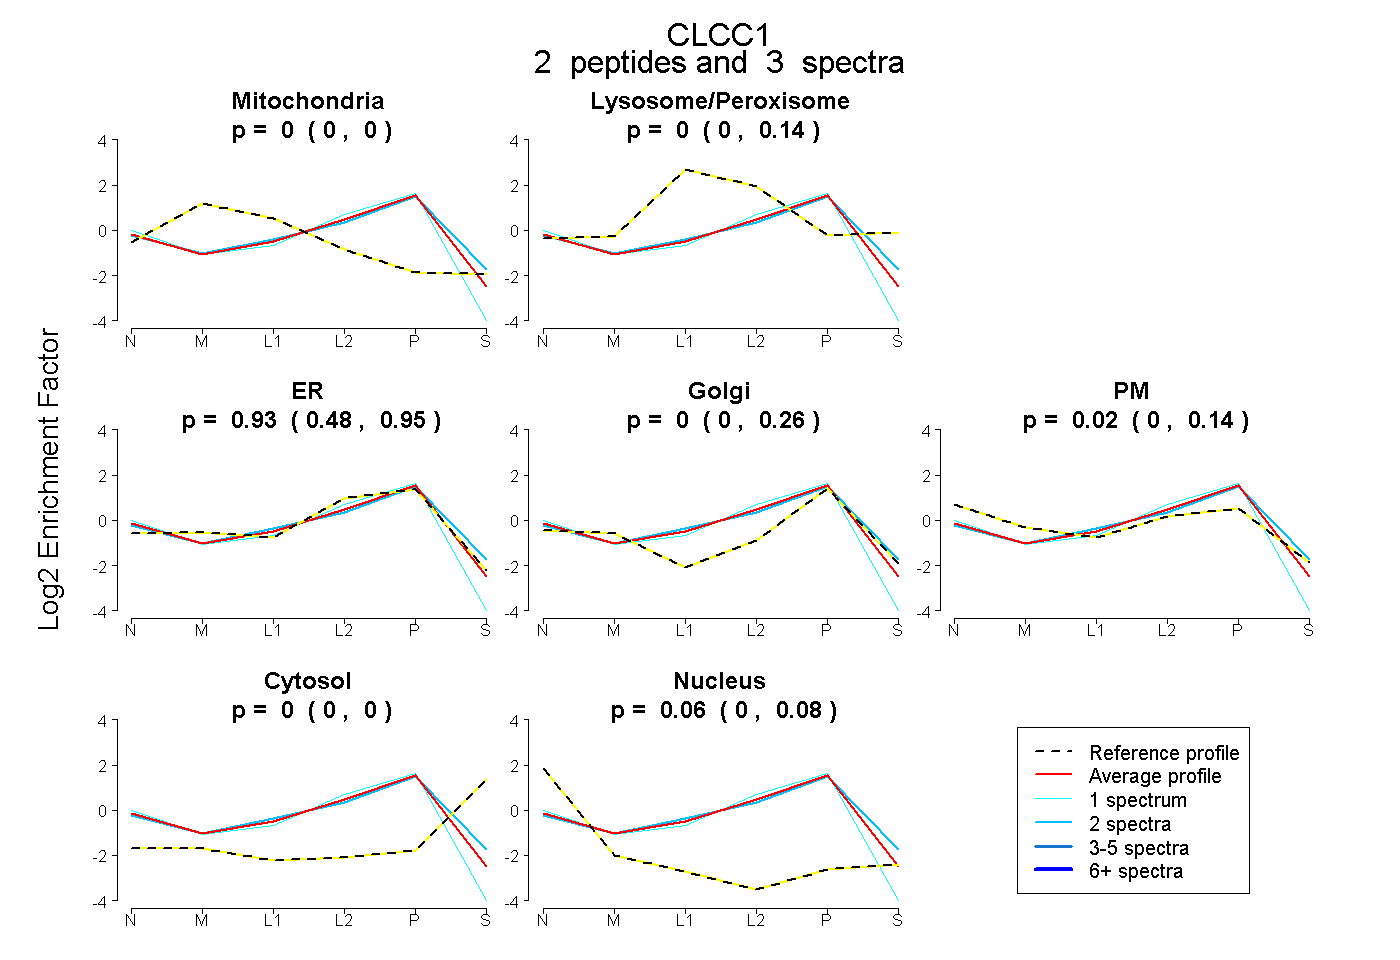
0.000 | 0.000
0.000 | 0.140
0.478 | 0.948
0.000 | 0.257
0.000 | 0.145
0.000 | 0.000
0.000 | 0.077
12peptides
spectra
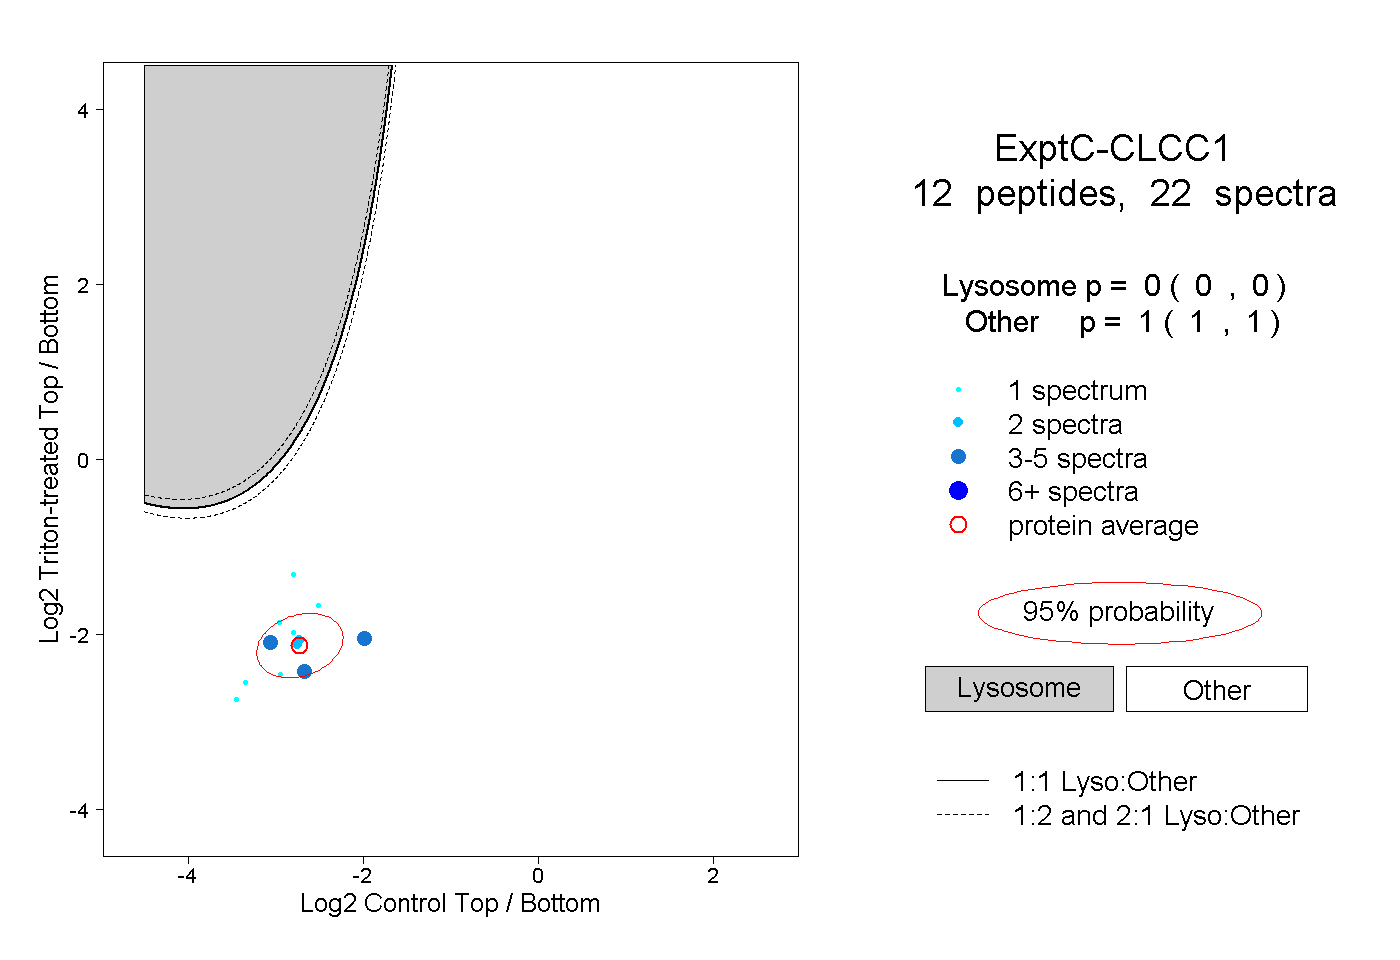
0.000 | 0.000
1.000 | 1.000
1peptide
spectrum
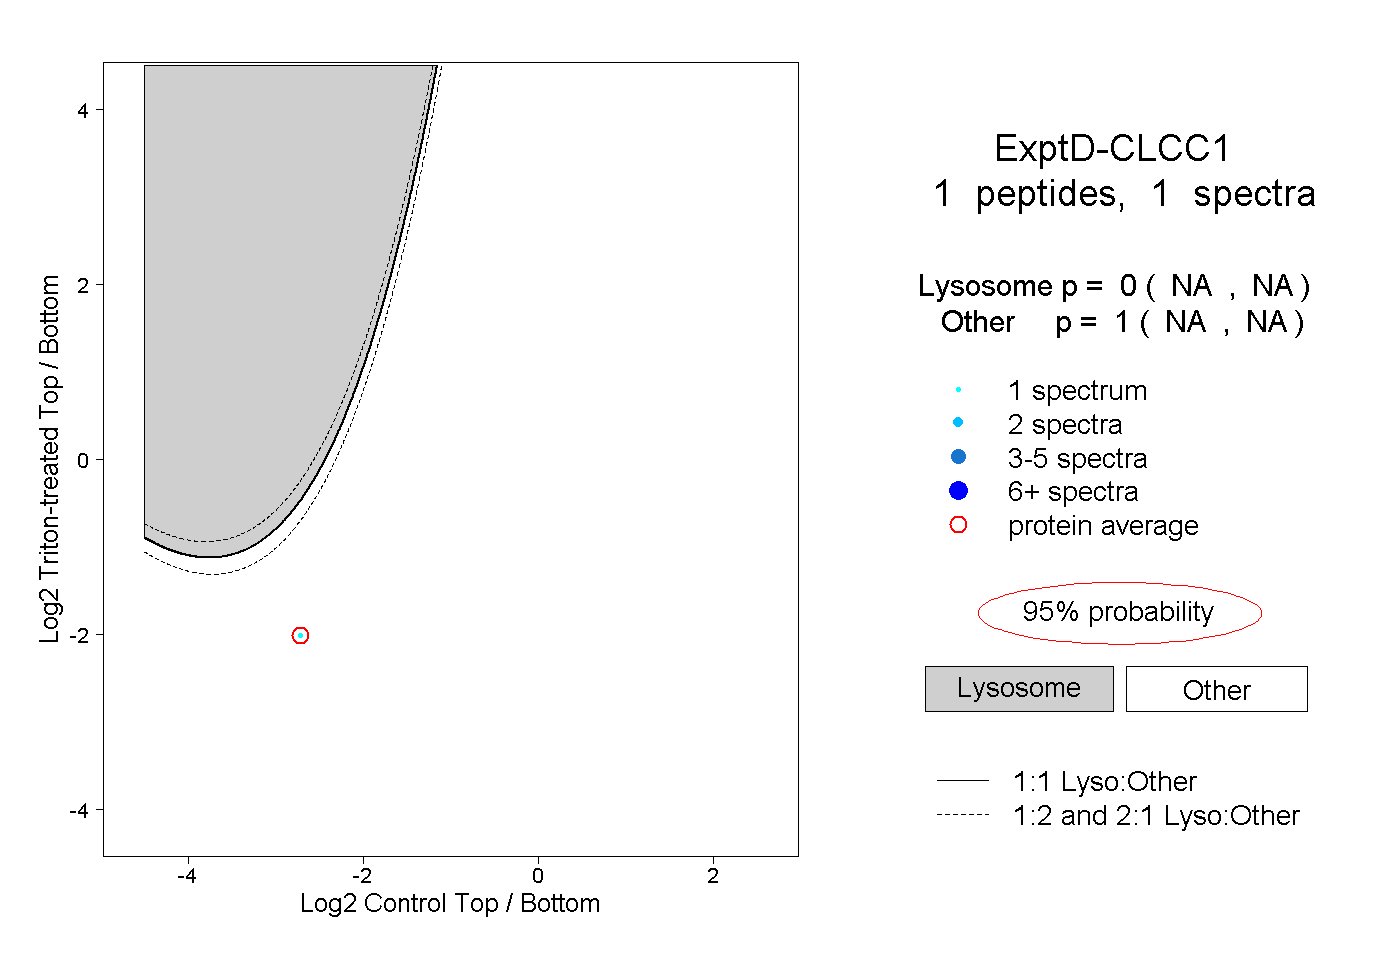
NA | NA
NA | NA