 8
8peptides
spectra
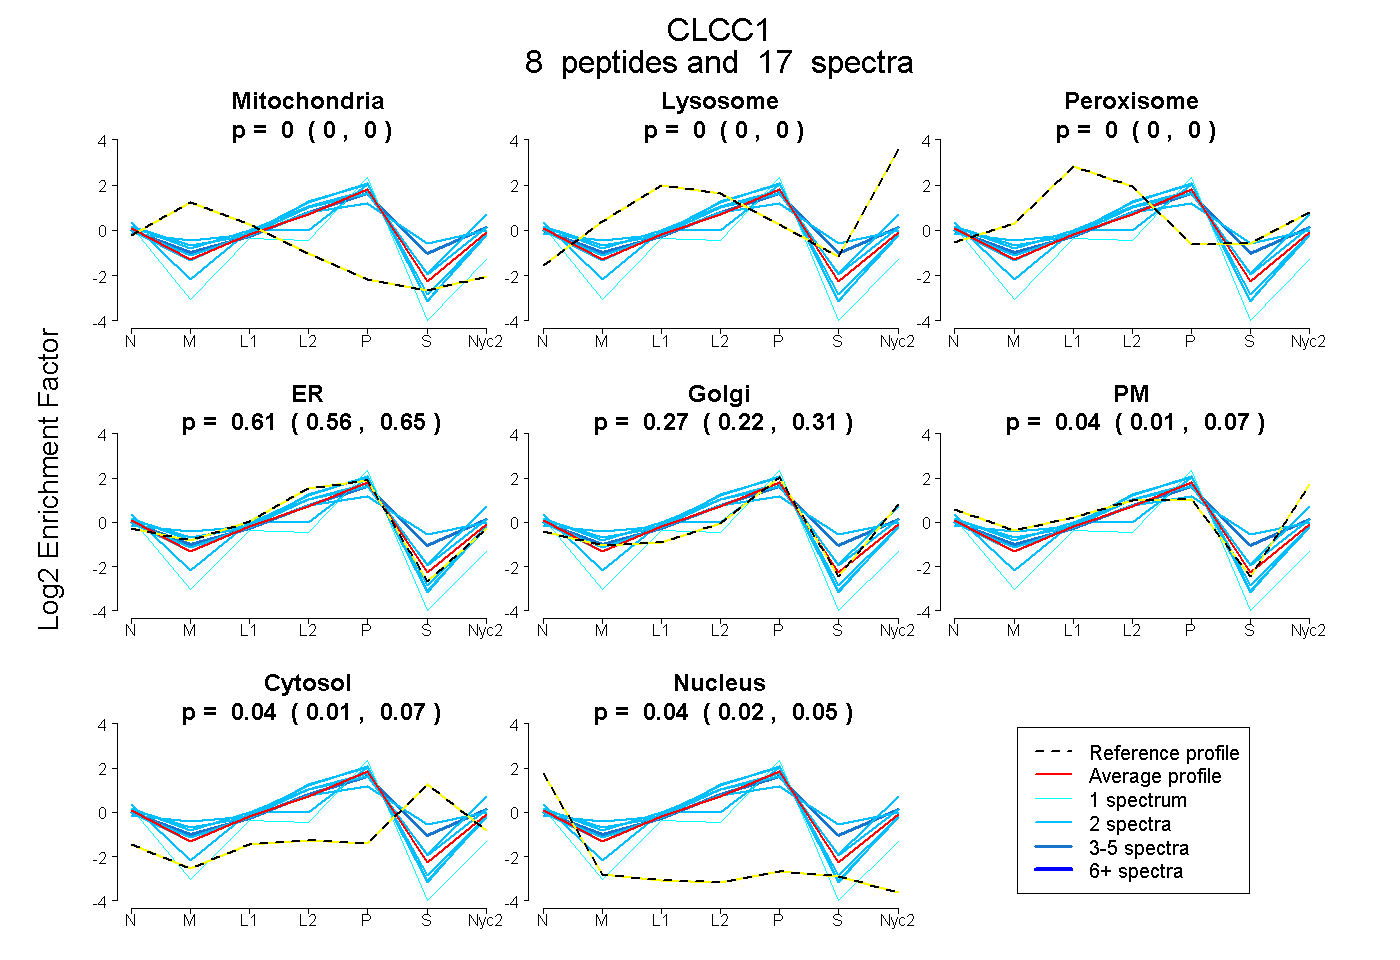
0.000 | 0.000
0.000 | 0.000
0.000 | 0.001
0.562 | 0.648
0.219 | 0.309
0.006 | 0.068
0.005 | 0.072
0.021 | 0.055
| Plot | Mito | Lyso | Perox | ER | Golgi | PM | Cytosol | Nucleus | |||||
| Expt A |
8 peptides |
17 spectra |
|
0.000 0.000 | 0.000 |
0.000 0.000 | 0.000 |
0.000 0.000 | 0.001 |
0.608 0.562 | 0.648 |
0.267 0.219 | 0.309 |
0.042 0.006 | 0.068 |
0.043 0.005 | 0.072 |
0.039 0.021 | 0.055 |
| 2 spectra, SHDSEAWK | 0.000 | 0.000 | 0.007 | 0.624 | 0.059 | 0.234 | 0.077 | 0.000 | ||
| 2 spectra, YGTSEK | 0.000 | 0.000 | 0.083 | 0.414 | 0.000 | 0.231 | 0.272 | 0.000 | ||
| 2 spectra, YDAEILLTR | 0.000 | 0.000 | 0.000 | 0.843 | 0.134 | 0.000 | 0.000 | 0.023 | ||
| 2 spectra, ETSELPR | 0.000 | 0.000 | 0.000 | 0.429 | 0.463 | 0.000 | 0.000 | 0.108 | ||
| 2 spectra, VAFAQHQANVAK | 0.000 | 0.058 | 0.047 | 0.368 | 0.274 | 0.220 | 0.034 | 0.000 | ||
| 2 spectra, ALEPDDR | 0.000 | 0.000 | 0.000 | 0.857 | 0.117 | 0.000 | 0.000 | 0.026 | ||
| 4 spectra, GTGEFIK | 0.000 | 0.000 | 0.053 | 0.446 | 0.189 | 0.125 | 0.187 | 0.000 | ||
| 1 spectrum, SPEVLR | 0.000 | 0.000 | 0.000 | 0.511 | 0.263 | 0.000 | 0.000 | 0.226 |
| Plot | Mito | Lyso or Perox | ER | Golgi | PM | Cytosol | Nucleus | ||||||
| Expt B |
2 peptides |
3 spectra |
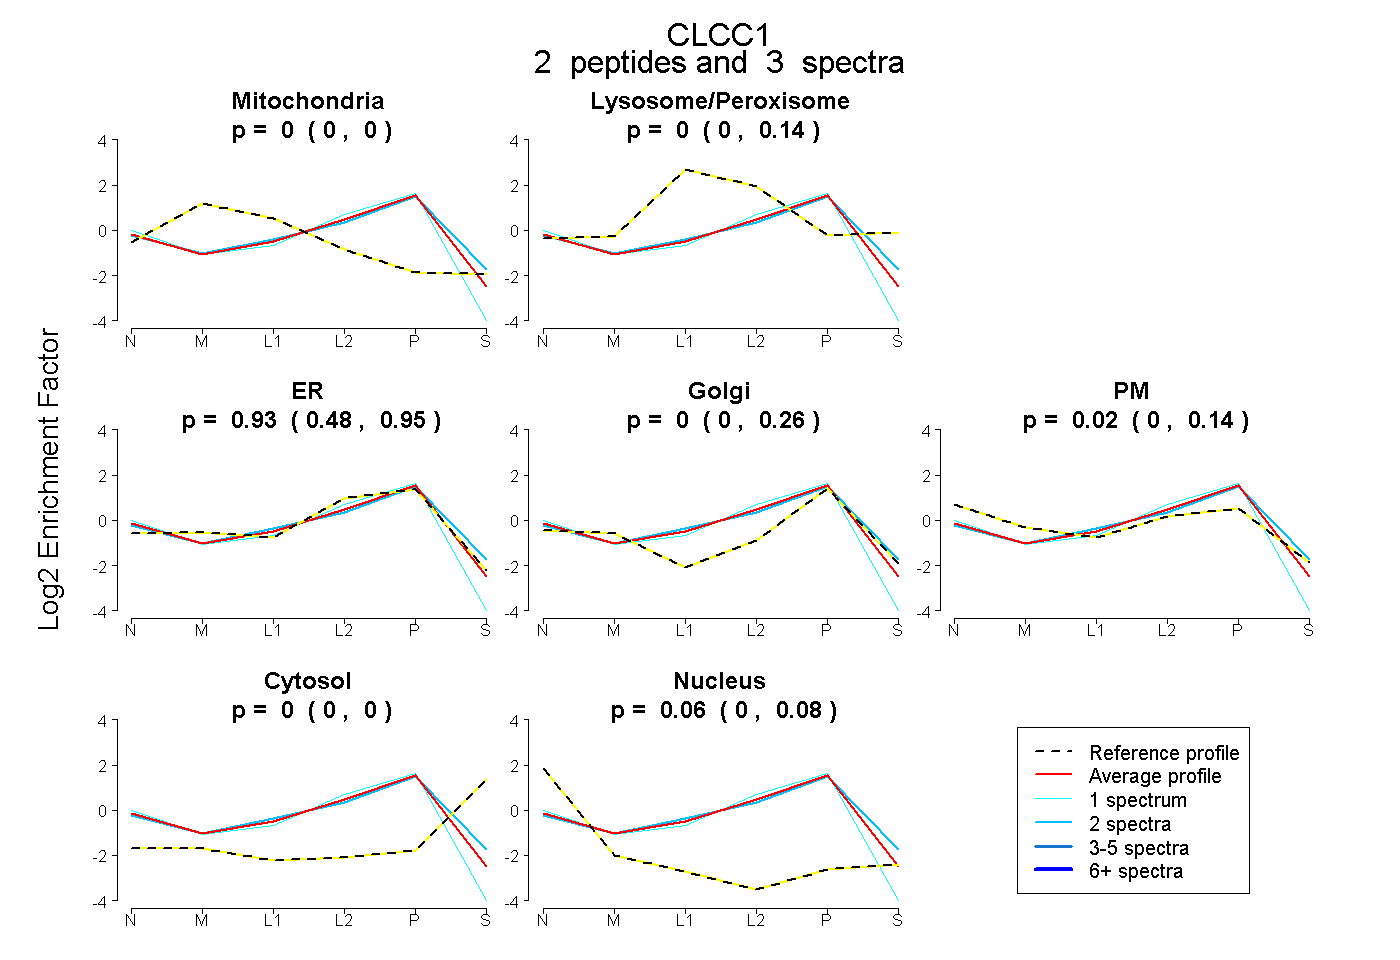 |
0.000 0.000 | 0.000 |
0.000 0.000 | 0.140 |
0.926 0.478 | 0.948 |
0.000 0.000 | 0.257 |
0.017 0.000 | 0.145 |
0.000 0.000 | 0.000 |
0.057 0.000 | 0.077 |
|||
| Plot | Lyso | Other | |||||||||||
| Expt C |
12 peptides |
22 spectra |
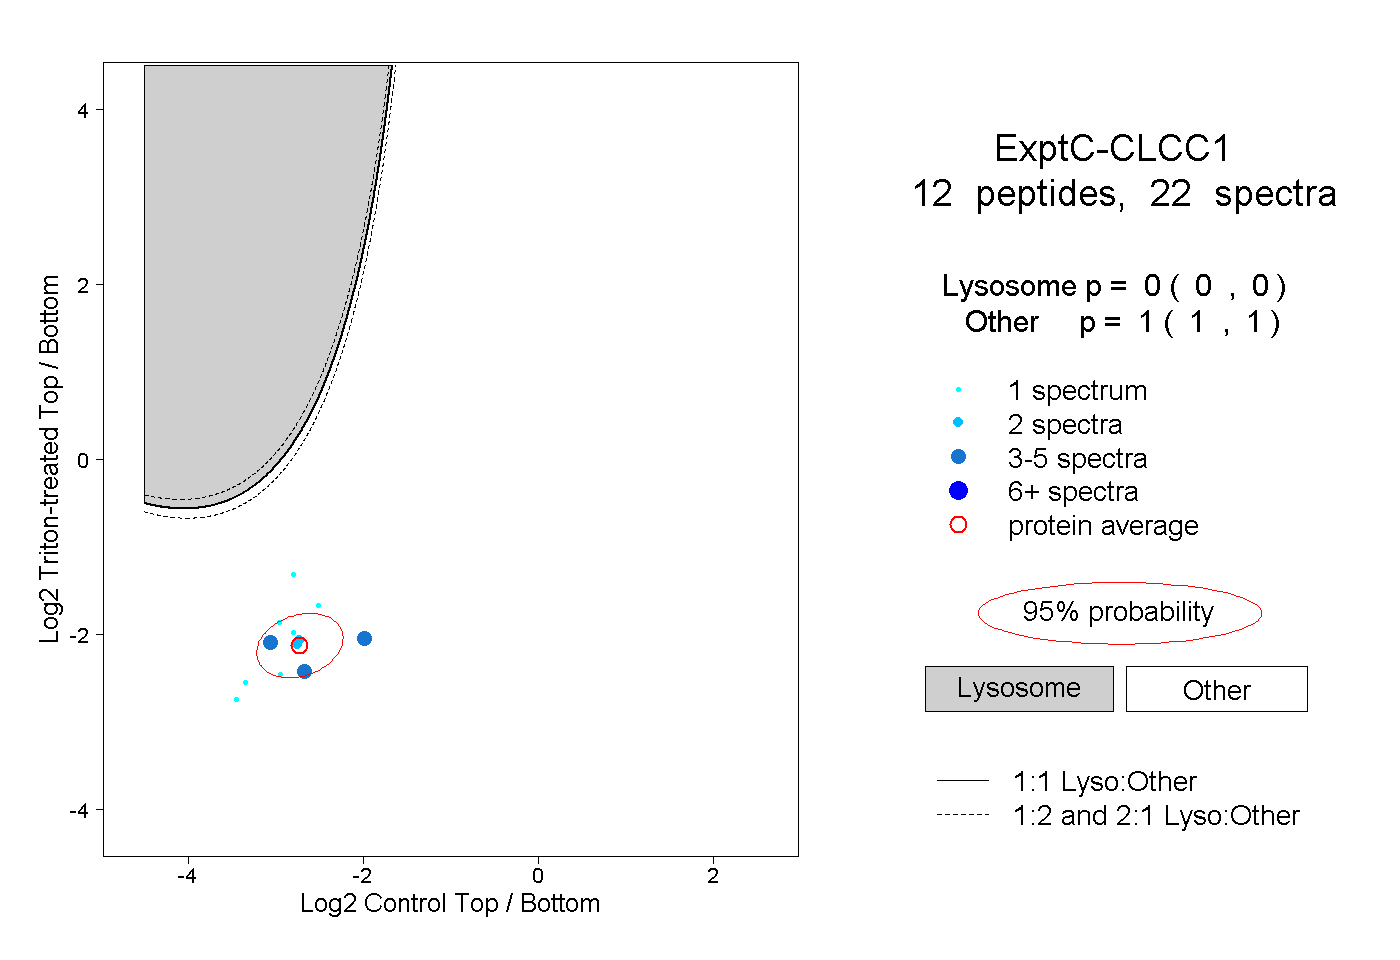 |
0.000 0.000 | 0.000 |
1.000 1.000 | 1.000 |
||||||||
| Plot | Lyso | Other | |||||||||||
| Expt D |
1 peptide |
1 spectrum |
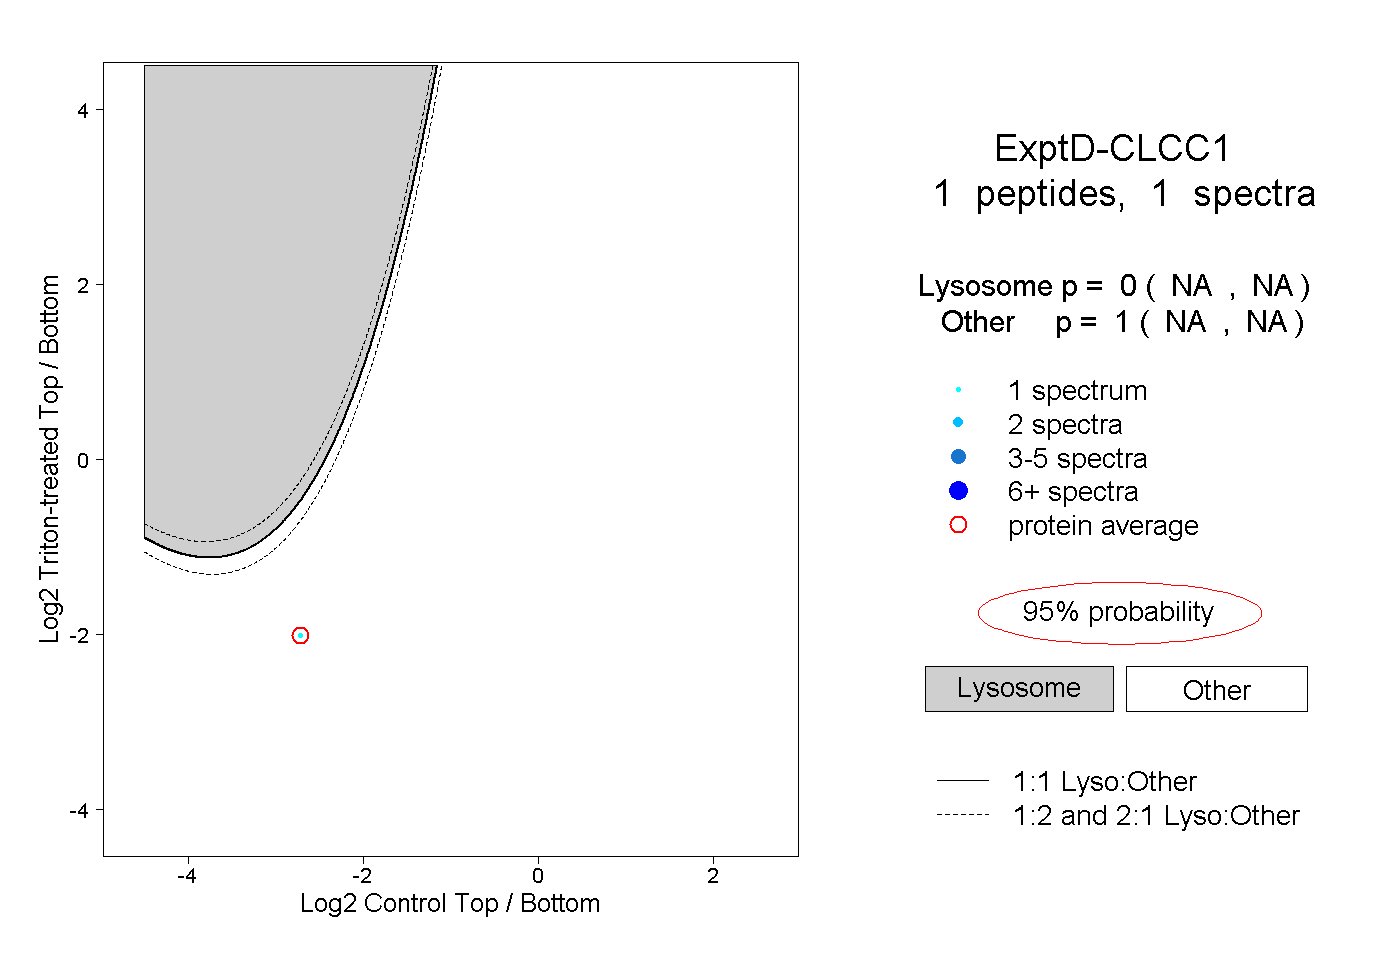 |
0.000 NA | NA |
1.000 NA | NA |