 12
12peptides
spectra
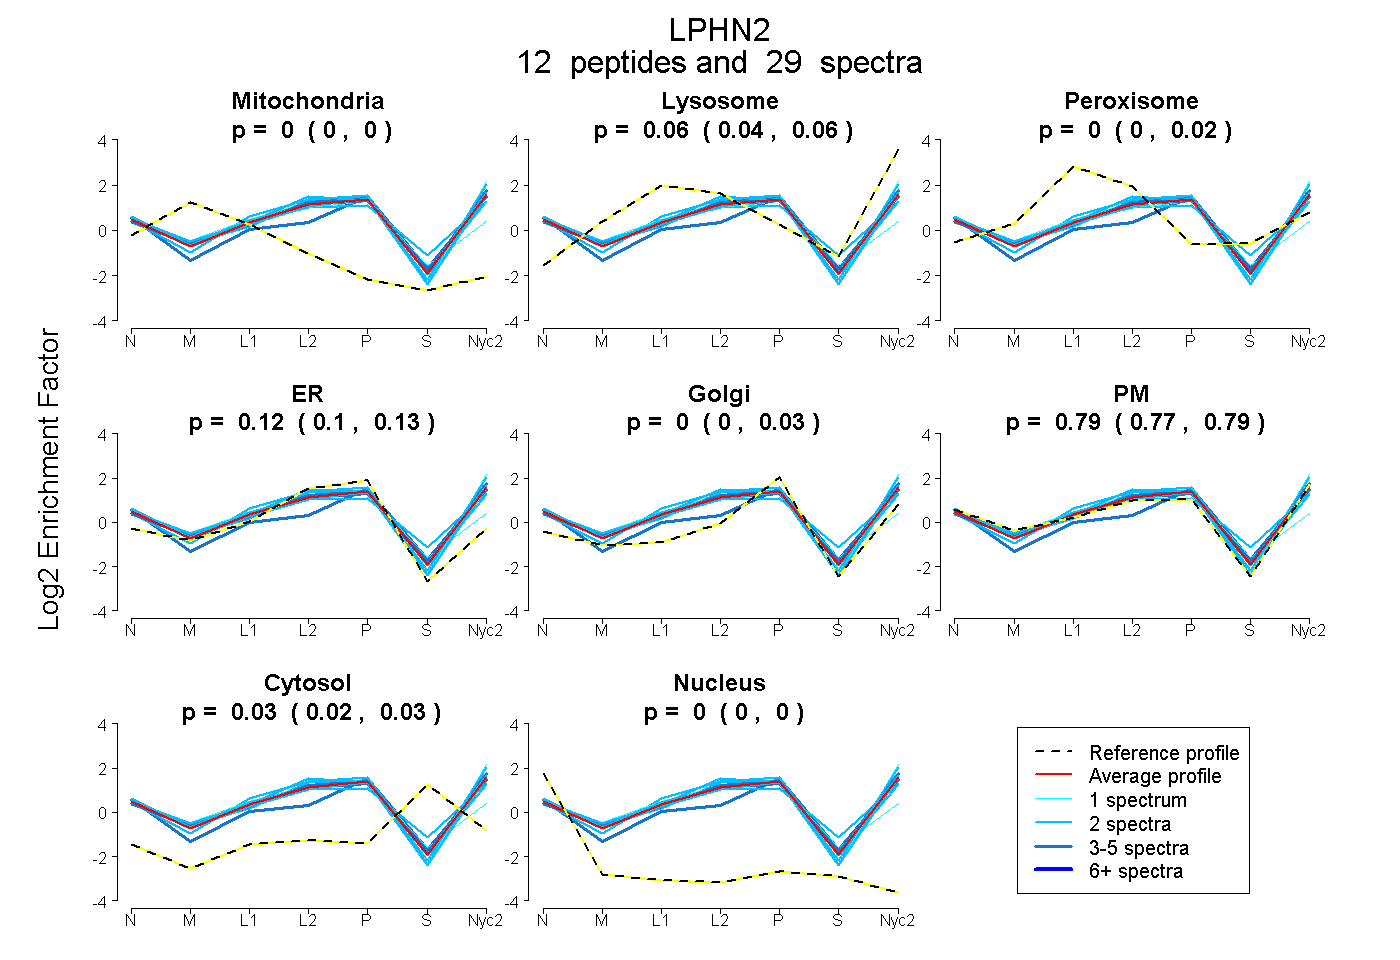
0.000 | 0.000
0.044 | 0.063
0.000 | 0.017
0.096 | 0.131
0.000 | 0.029
0.771 | 0.794
0.025 | 0.035
0.000 | 0.000
3peptides
spectra
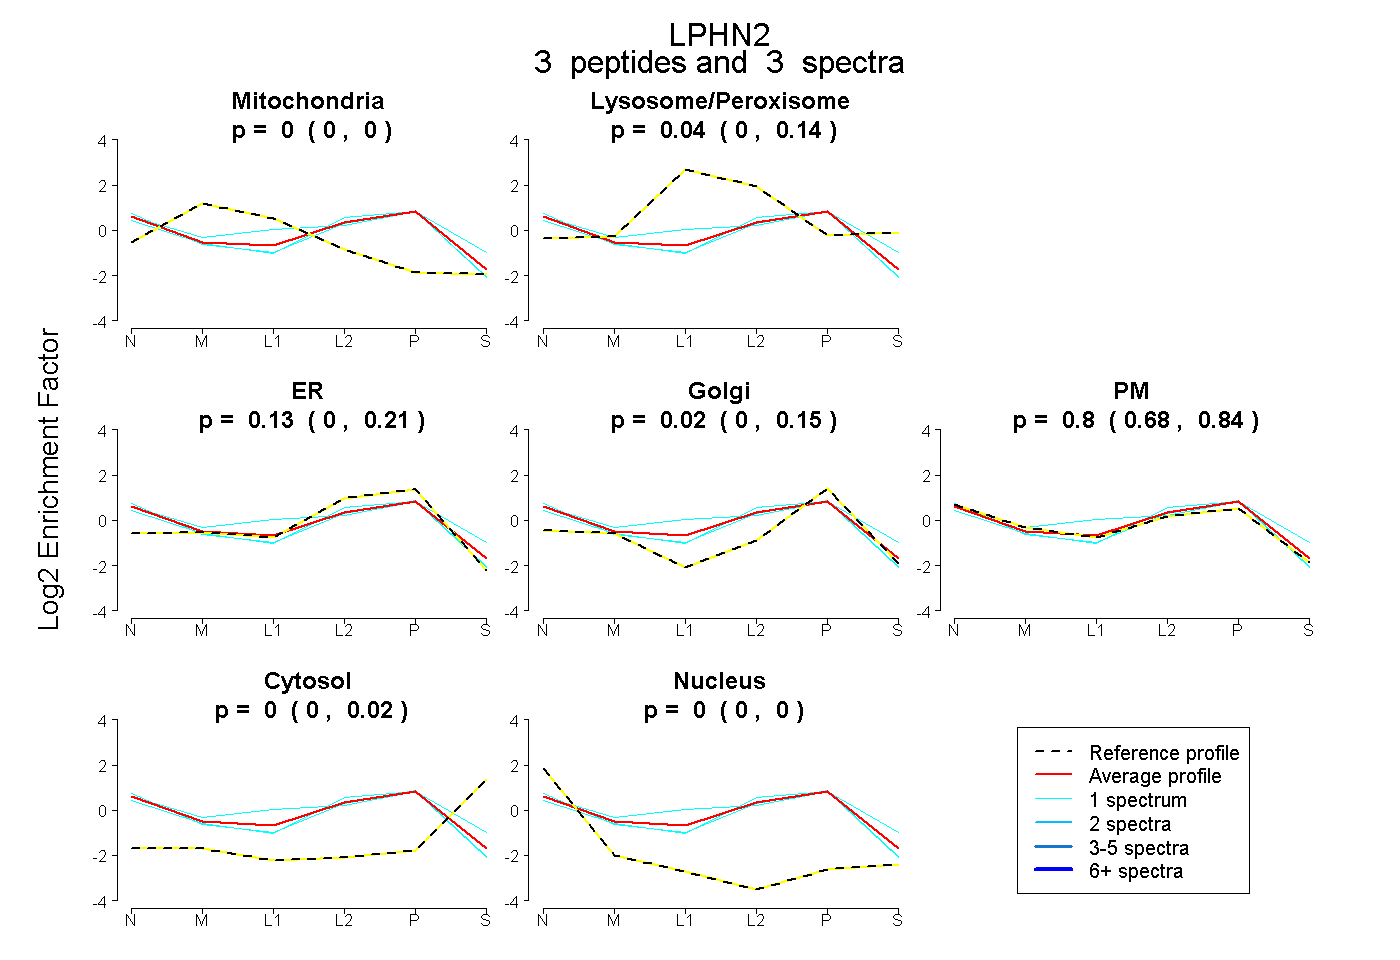
0.000 | 0.000
0.000 | 0.136
0.000 | 0.212
0.000 | 0.145
0.676 | 0.840
0.000 | 0.018
0.000 | 0.000
12peptides
spectra
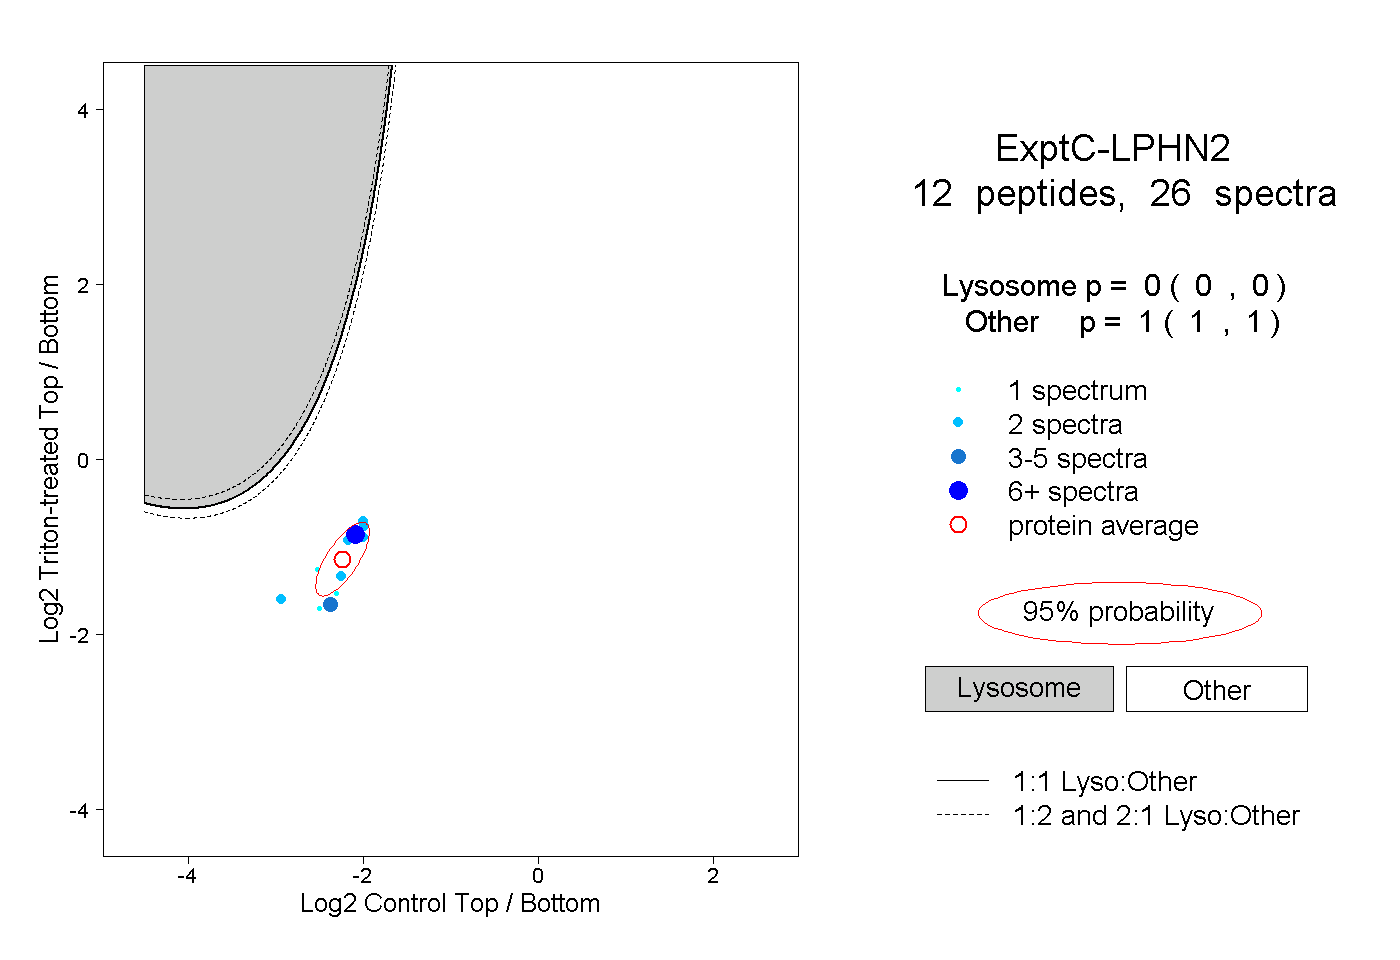
0.000 | 0.000
1.000 | 1.000
1peptide
spectrum
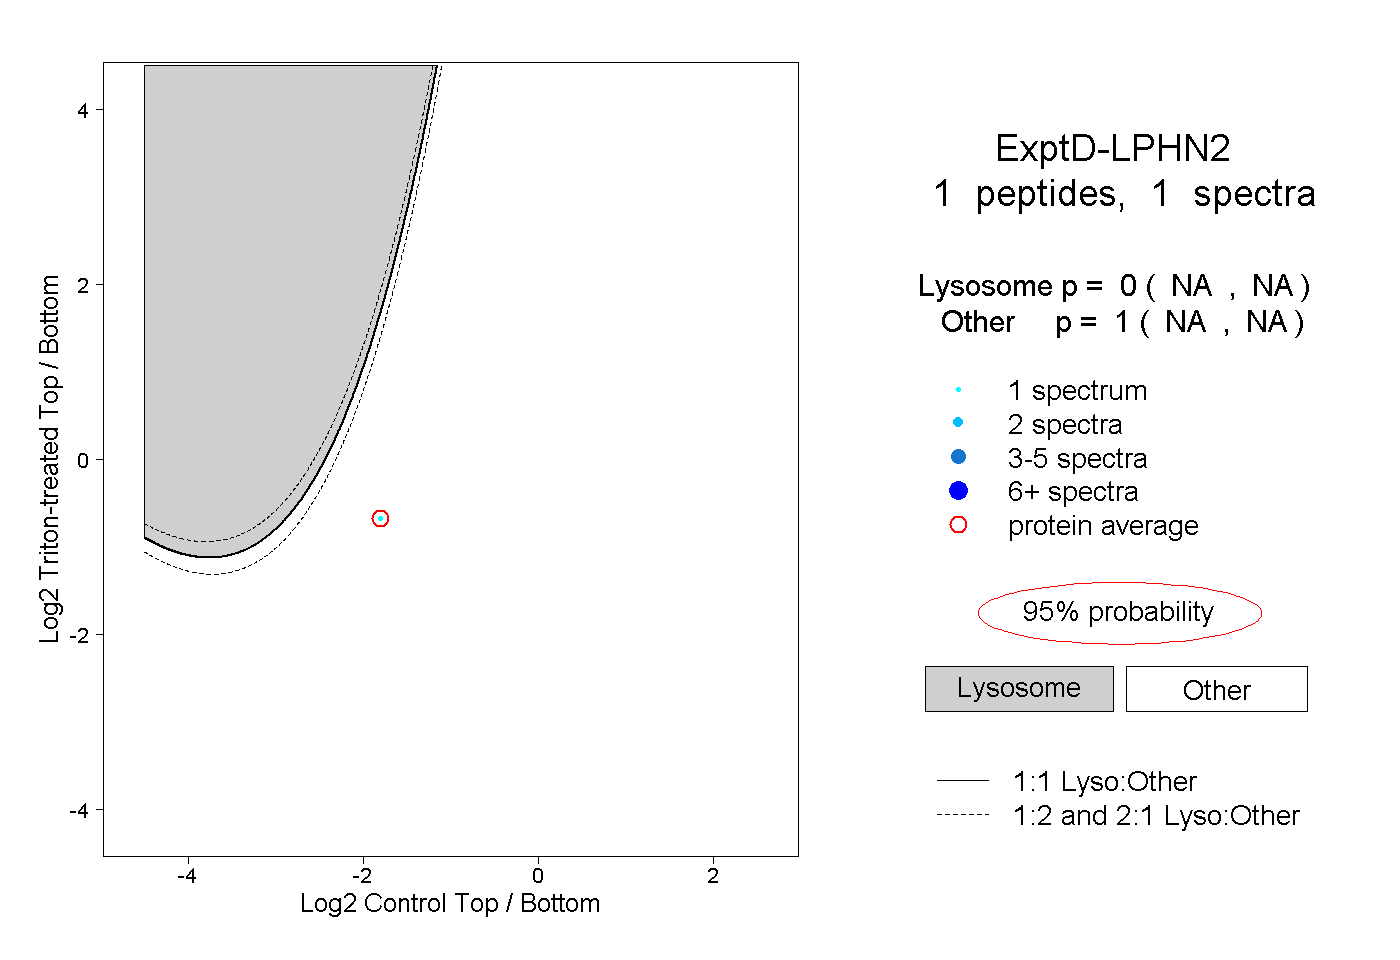
NA | NA
NA | NA