 12
12peptides
spectra
0.000 | 0.000
0.044 | 0.063
0.000 | 0.017
0.096 | 0.131
0.000 | 0.029
0.771 | 0.794
0.025 | 0.035
0.000 | 0.000
| Plot | Mito | Lyso | Perox | ER | Golgi | PM | Cytosol | Nucleus | |||||
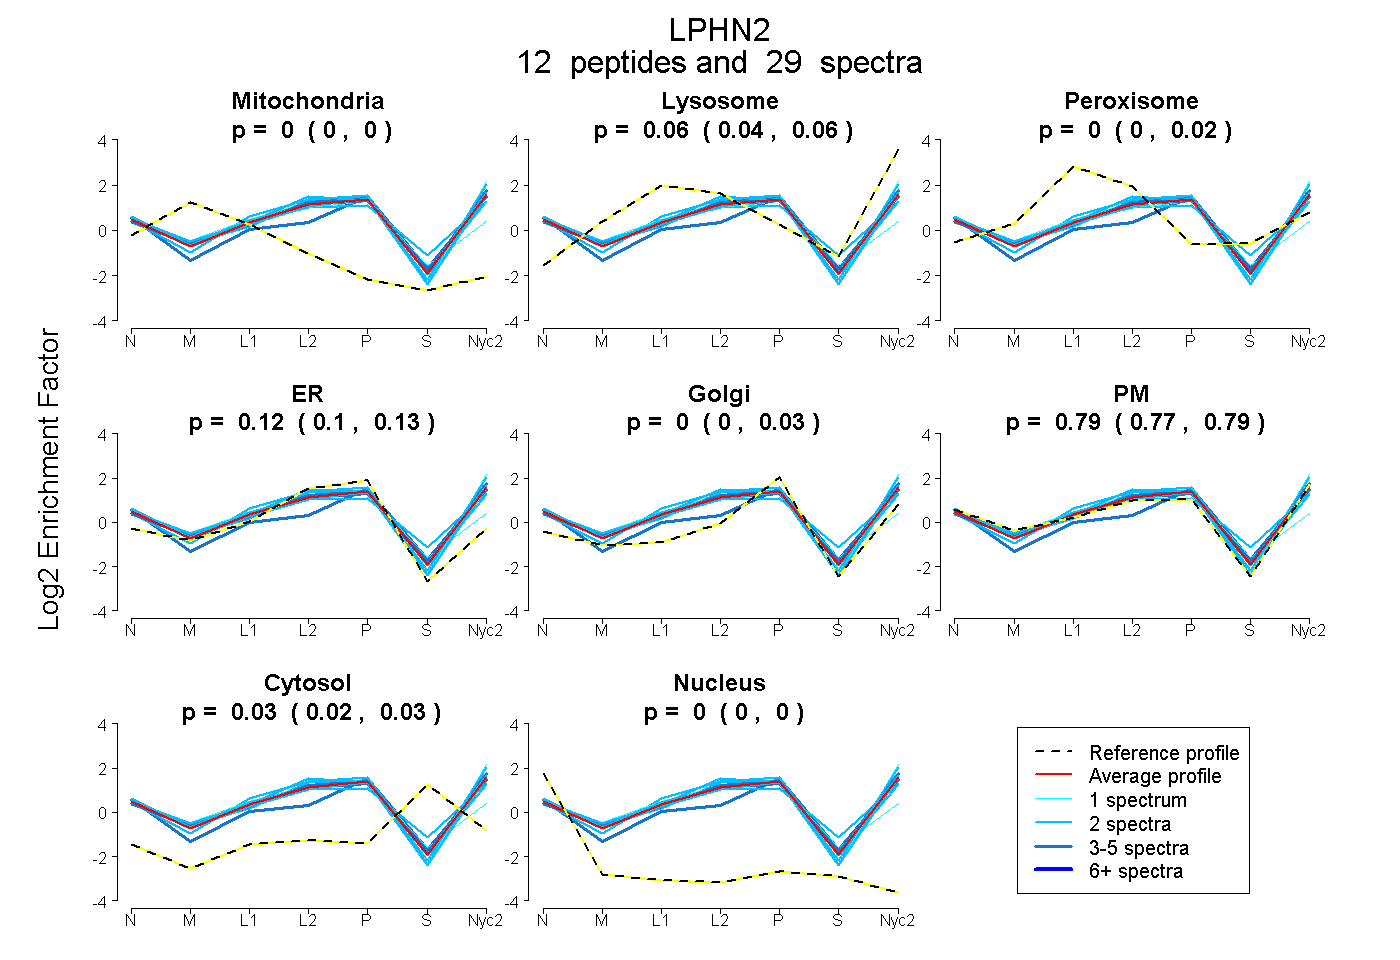
| Expt A |
12 peptides |
29 spectra |
|
0.000 0.000 | 0.000 |
0.058 0.044 | 0.063 |
0.000 0.000 | 0.017 |
0.122 0.096 | 0.131 |
0.000 0.000 | 0.029 |
0.788 0.771 | 0.794 |
0.032 0.025 | 0.035 |
0.000 0.000 | 0.000 |
| 2 spectra, AIVDSPSIYEAEQK | 0.000 | 0.004 | 0.177 | 0.003 | 0.088 | 0.626 | 0.102 | 0.000 | ||
| 4 spectra, LGADLLGR | 0.000 | 0.100 | 0.000 | 0.095 | 0.050 | 0.743 | 0.012 | 0.000 | ||
| 2 spectra, NVIDYIYNTR | 0.000 | 0.052 | 0.000 | 0.059 | 0.053 | 0.809 | 0.028 | 0.000 | ||
| 1 spectrum, IYFMPWTPYR | 0.000 | 0.105 | 0.000 | 0.000 | 0.000 | 0.894 | 0.000 | 0.000 | ||
| 2 spectra, EGCIPEGDVR | 0.000 | 0.038 | 0.066 | 0.298 | 0.000 | 0.593 | 0.005 | 0.000 | ||
| 2 spectra, VVFIIYR | 0.000 | 0.106 | 0.000 | 0.039 | 0.000 | 0.854 | 0.000 | 0.000 | ||
| 2 spectra, FCEALEMK | 0.000 | 0.031 | 0.000 | 0.120 | 0.000 | 0.849 | 0.000 | 0.000 | ||
| 2 spectra, SVYQDNESEAGK | 0.000 | 0.000 | 0.007 | 0.097 | 0.000 | 0.897 | 0.000 | 0.000 | ||
| 5 spectra, AALPFGLVR | 0.000 | 0.000 | 0.000 | 0.000 | 0.260 | 0.643 | 0.098 | 0.000 | ||
| 1 spectrum, ELSCEGYSIDLR | 0.000 | 0.000 | 0.122 | 0.389 | 0.000 | 0.396 | 0.083 | 0.009 | ||
| 2 spectra, AIVDTVDNLLR | 0.000 | 0.068 | 0.000 | 0.095 | 0.000 | 0.837 | 0.000 | 0.000 | ||
| 4 spectra, GTVFAGDVSSSVR | 0.000 | 0.080 | 0.000 | 0.055 | 0.000 | 0.837 | 0.028 | 0.000 |
| Plot | Mito | Lyso or Perox | ER | Golgi | PM | Cytosol | Nucleus | ||||||
| Expt B |
3 peptides |
3 spectra |
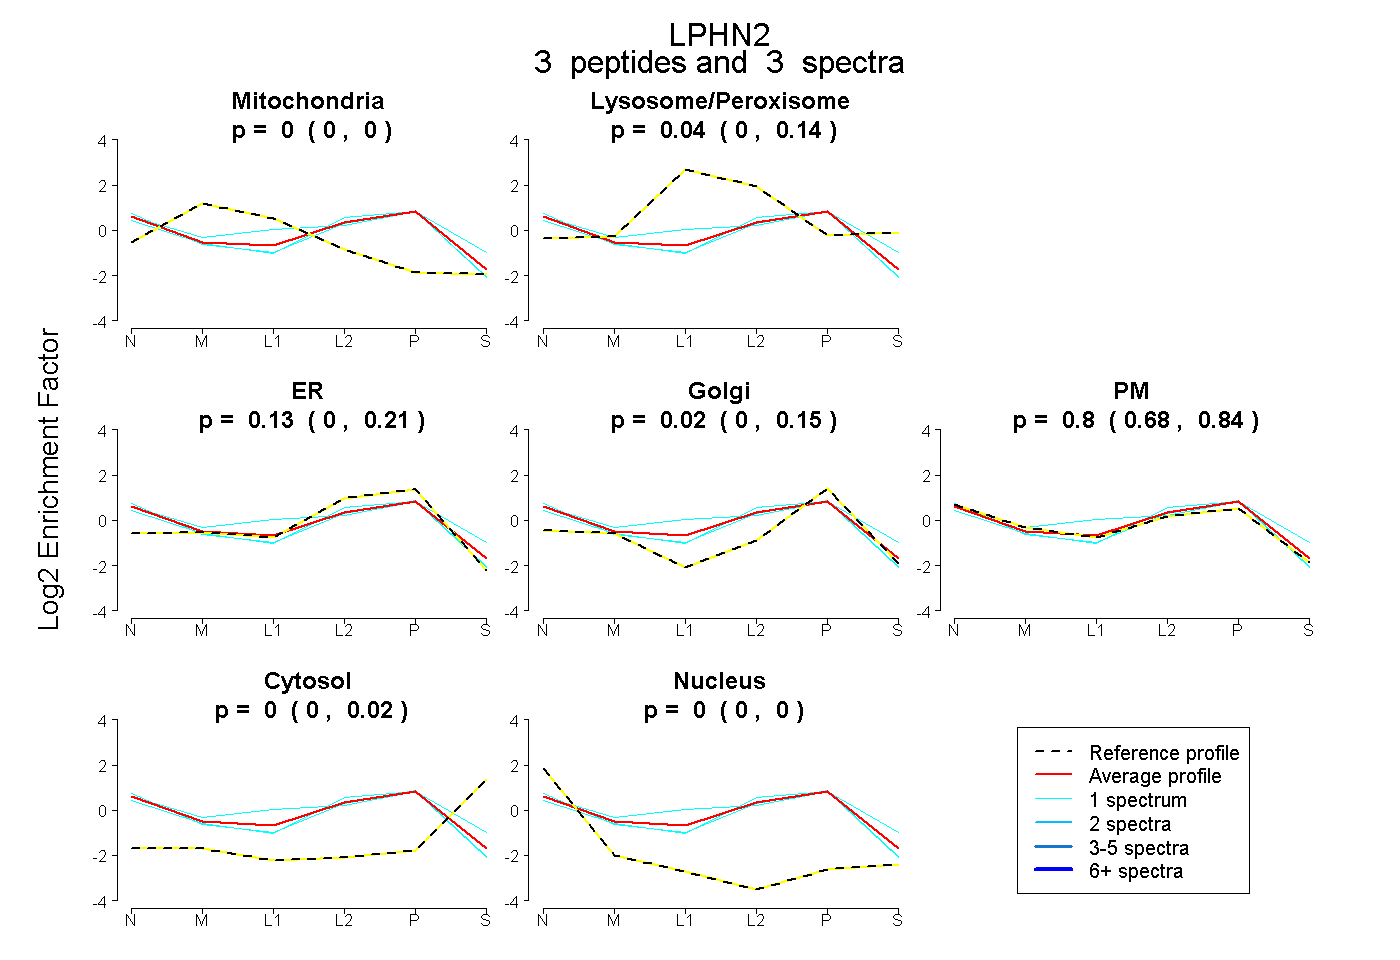 |
0.000 0.000 | 0.000 |
0.044 0.000 | 0.136 |
0.135 0.000 | 0.212 |
0.023 0.000 | 0.145 |
0.798 0.676 | 0.840 |
0.000 0.000 | 0.018 |
0.000 0.000 | 0.000 |
|||
| Plot | Lyso | Other | |||||||||||
| Expt C |
12 peptides |
26 spectra |
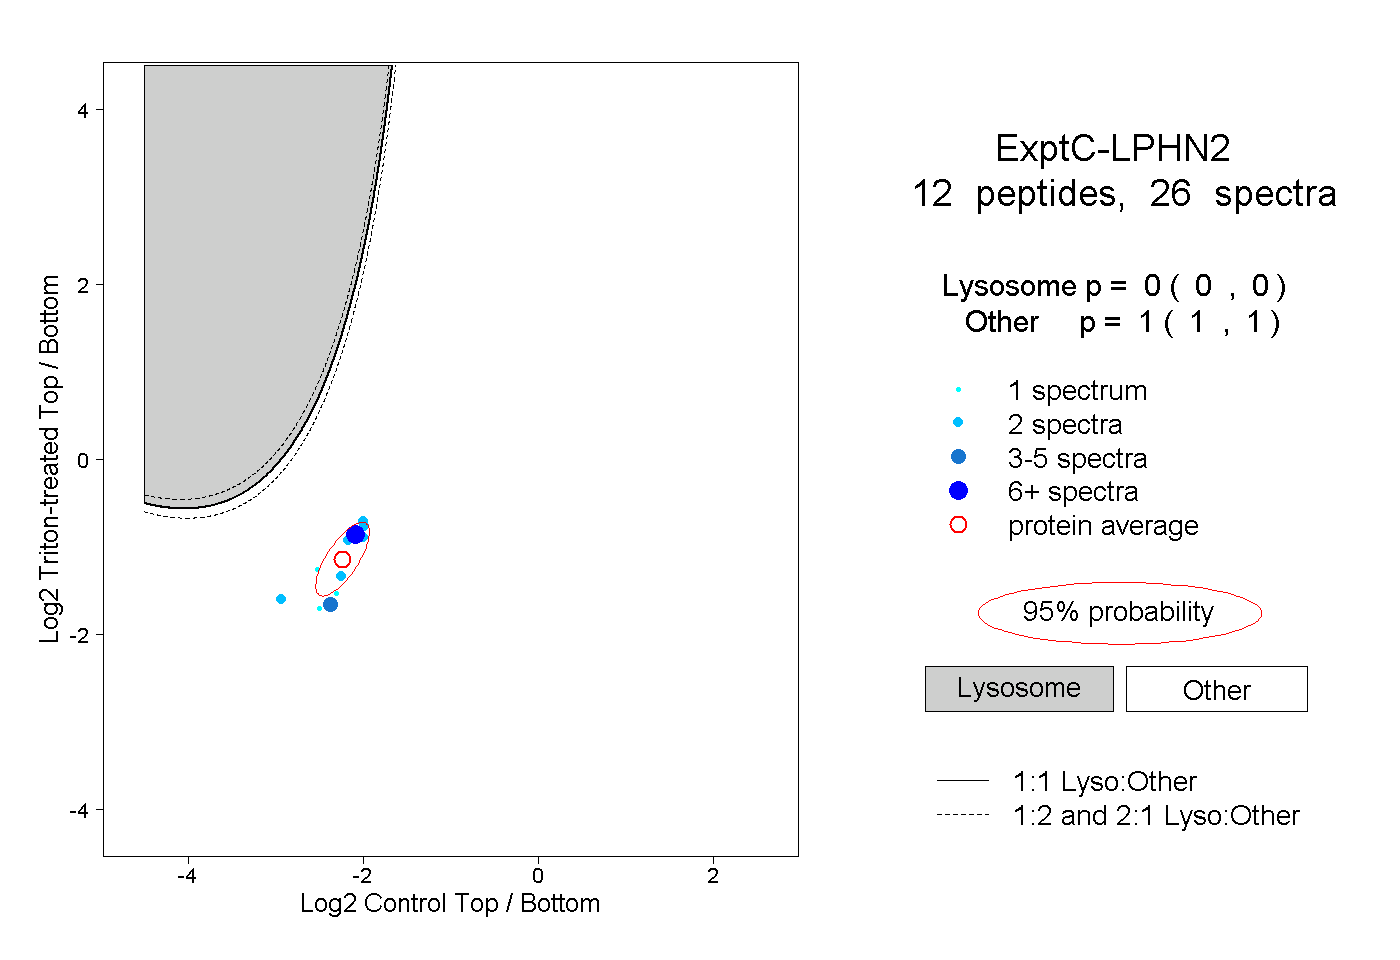 |
0.000 0.000 | 0.000 |
1.000 1.000 | 1.000 |
||||||||
| Plot | Lyso | Other | |||||||||||
| Expt D |
1 peptide |
1 spectrum |
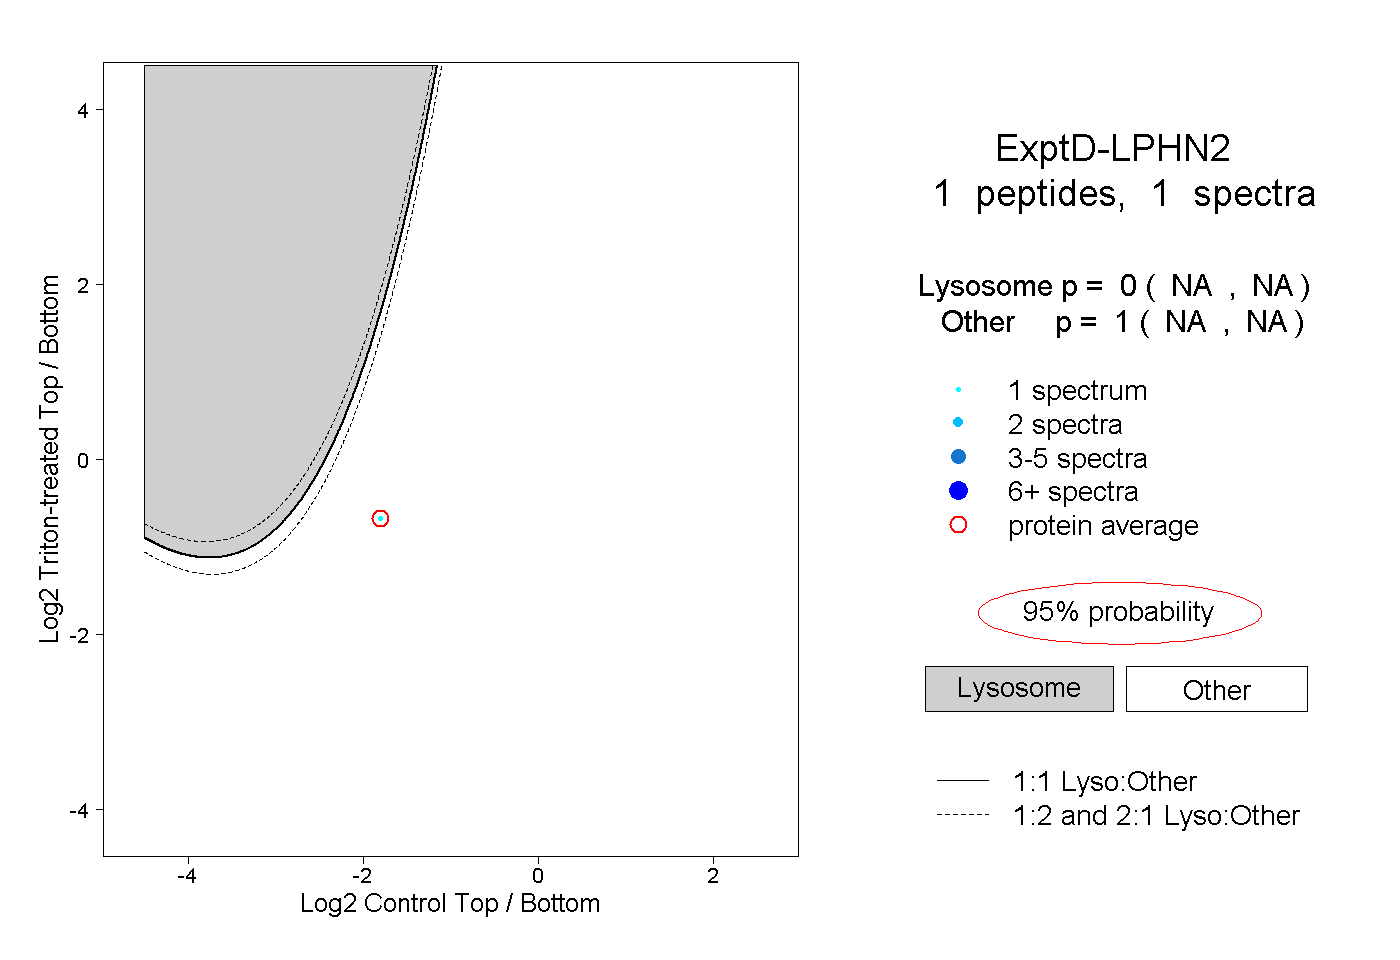 |
0.000 NA | NA |
1.000 NA | NA |