 10
10peptides
spectra
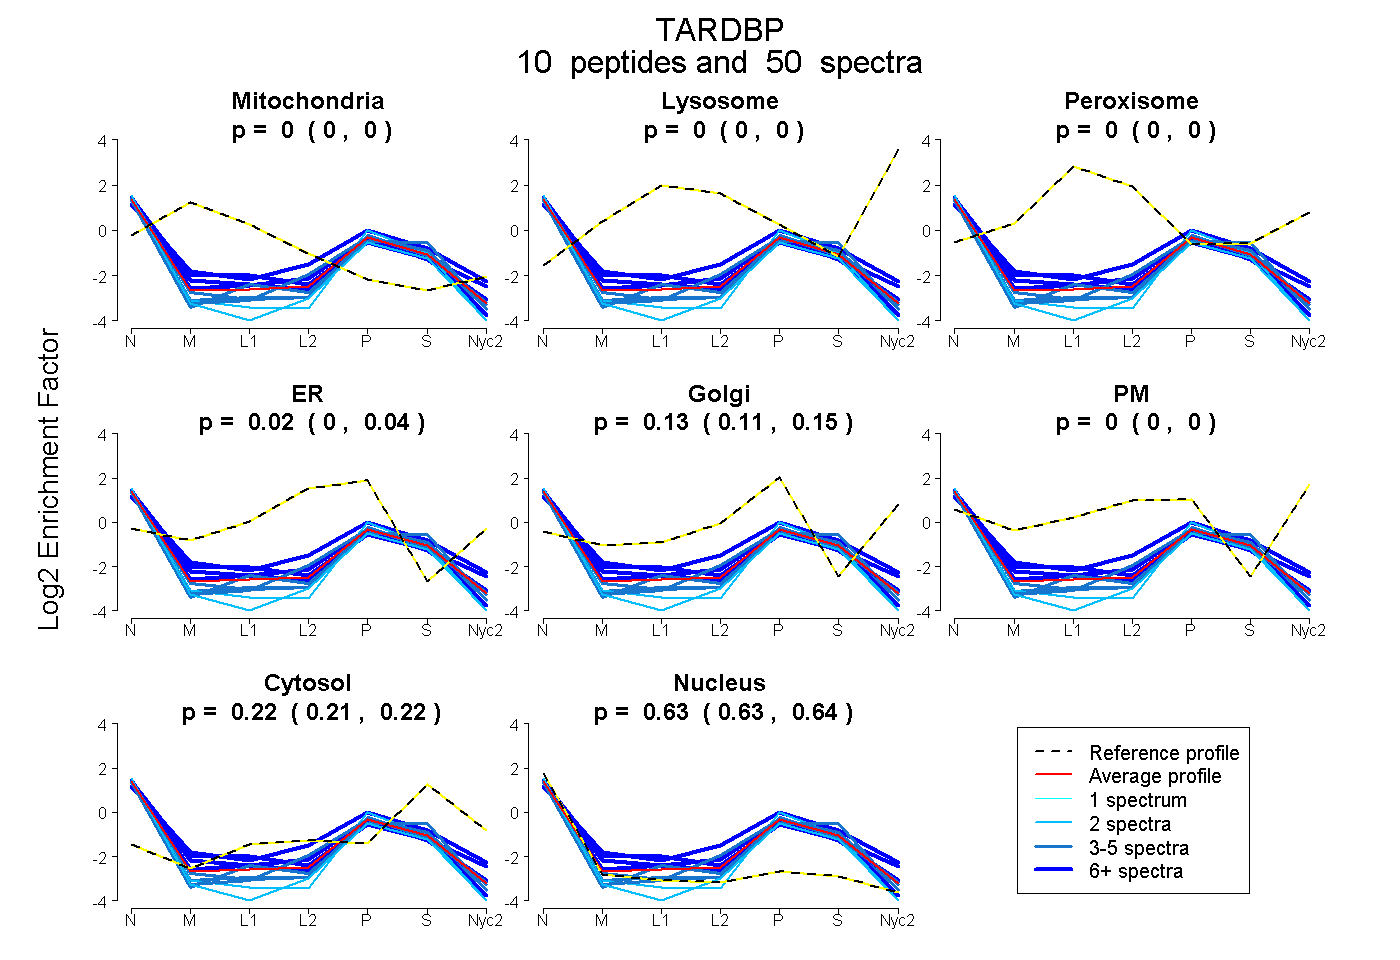
0.000 | 0.000
0.000 | 0.000
0.000 | 0.000
0.000 | 0.037
0.108 | 0.151
0.000 | 0.000
0.215 | 0.222
0.625 | 0.635
3peptides
spectra
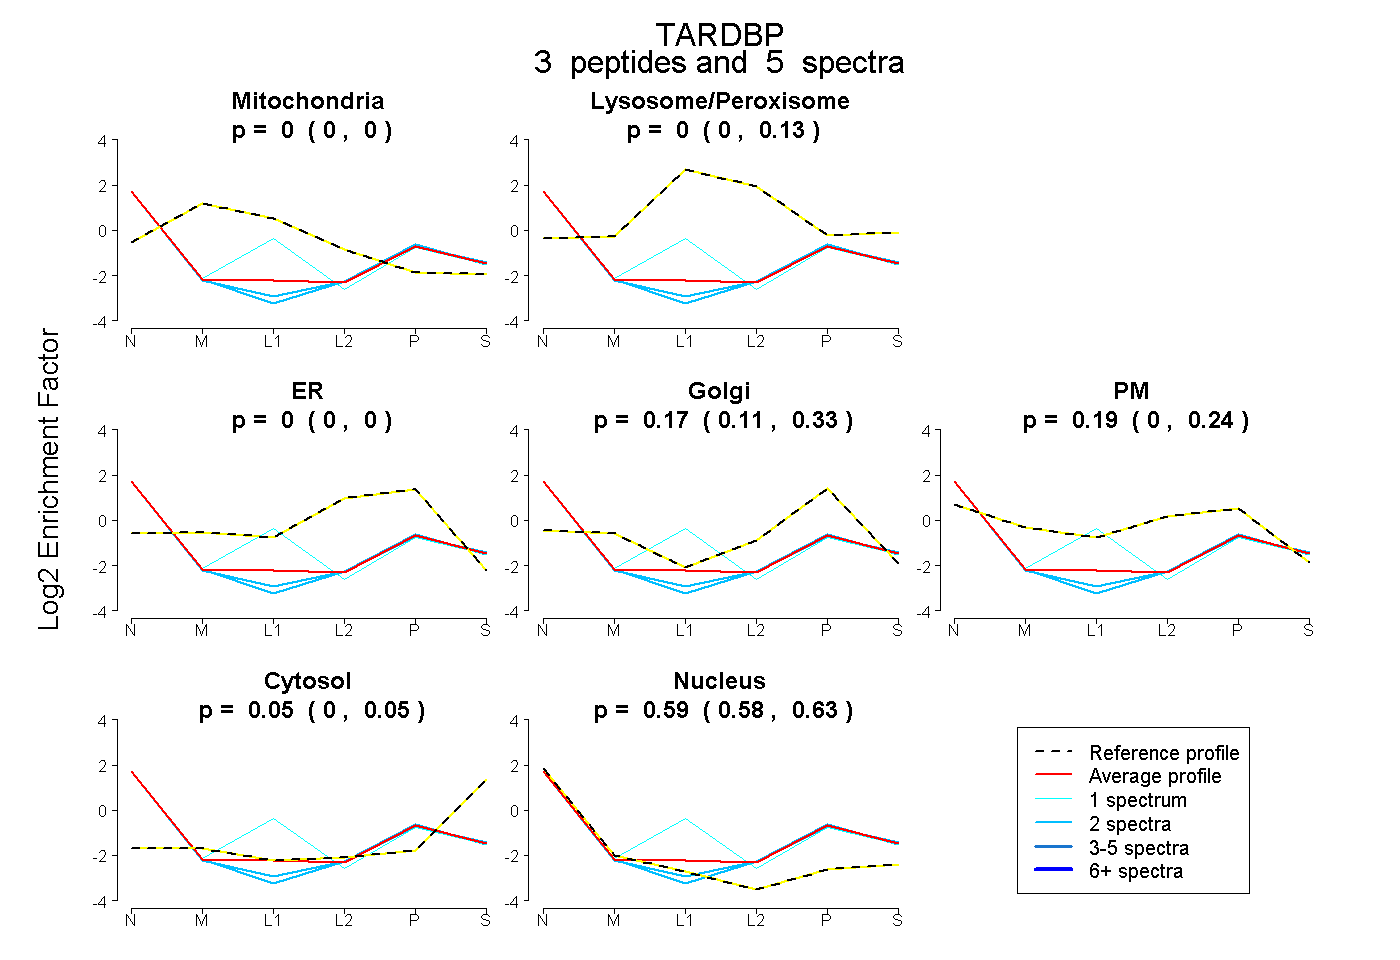
0.000 | 0.000
0.000 | 0.126
0.000 | 0.000
0.111 | 0.329
0.000 | 0.238
0.000 | 0.054
0.576 | 0.634
5peptides
spectra
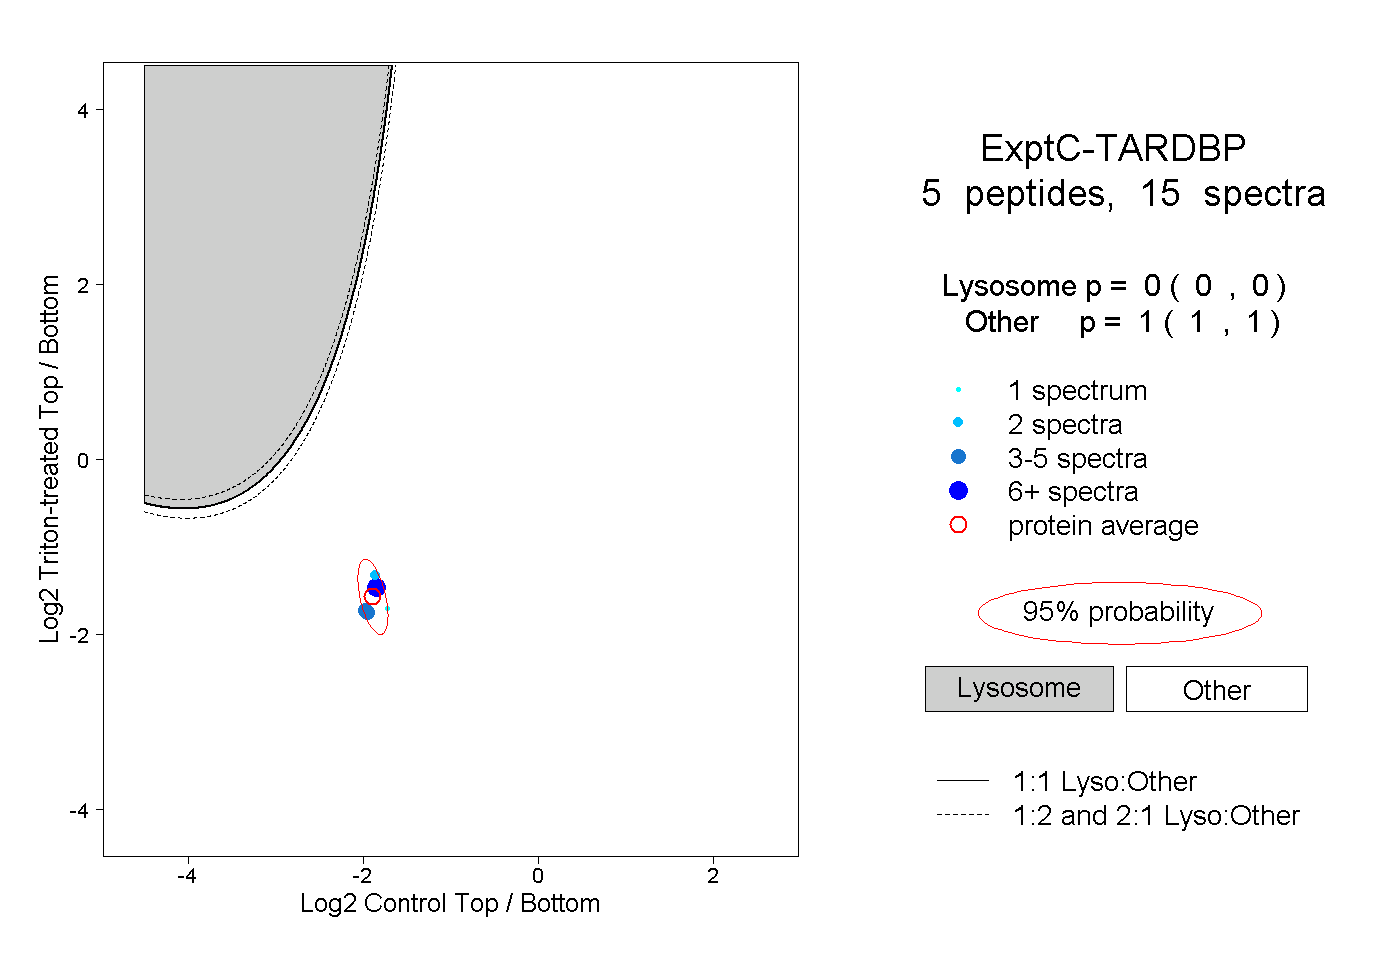
0.000 | 0.000
1.000 | 1.000
1peptide
spectrum
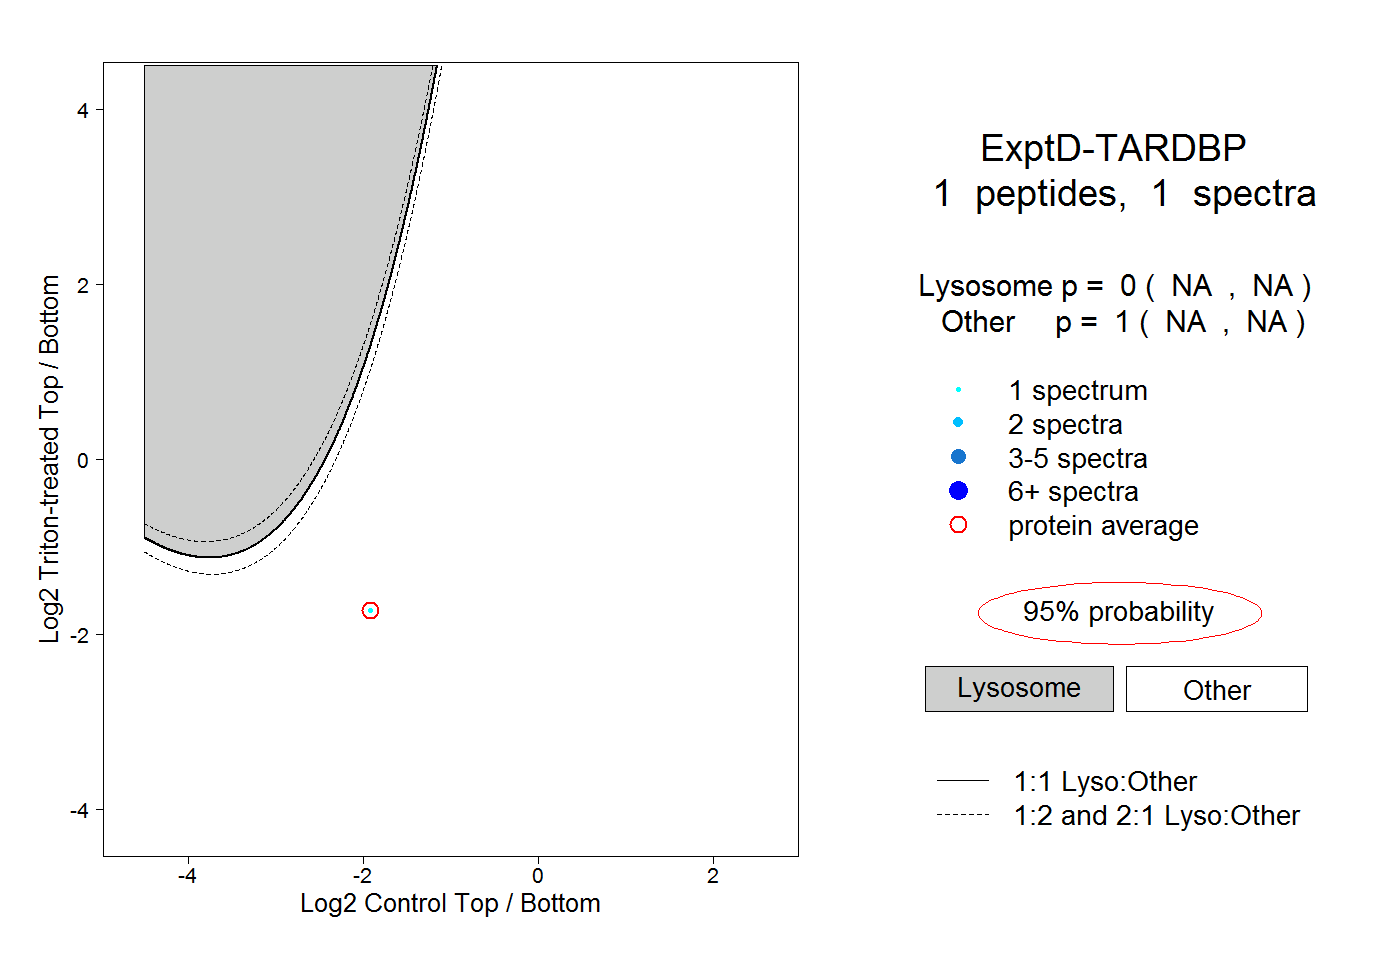
NA | NA
NA | NA