 10
10peptides
spectra
0.000 | 0.000
0.000 | 0.000
0.000 | 0.000
0.000 | 0.037
0.108 | 0.151
0.000 | 0.000
0.215 | 0.222
0.625 | 0.635
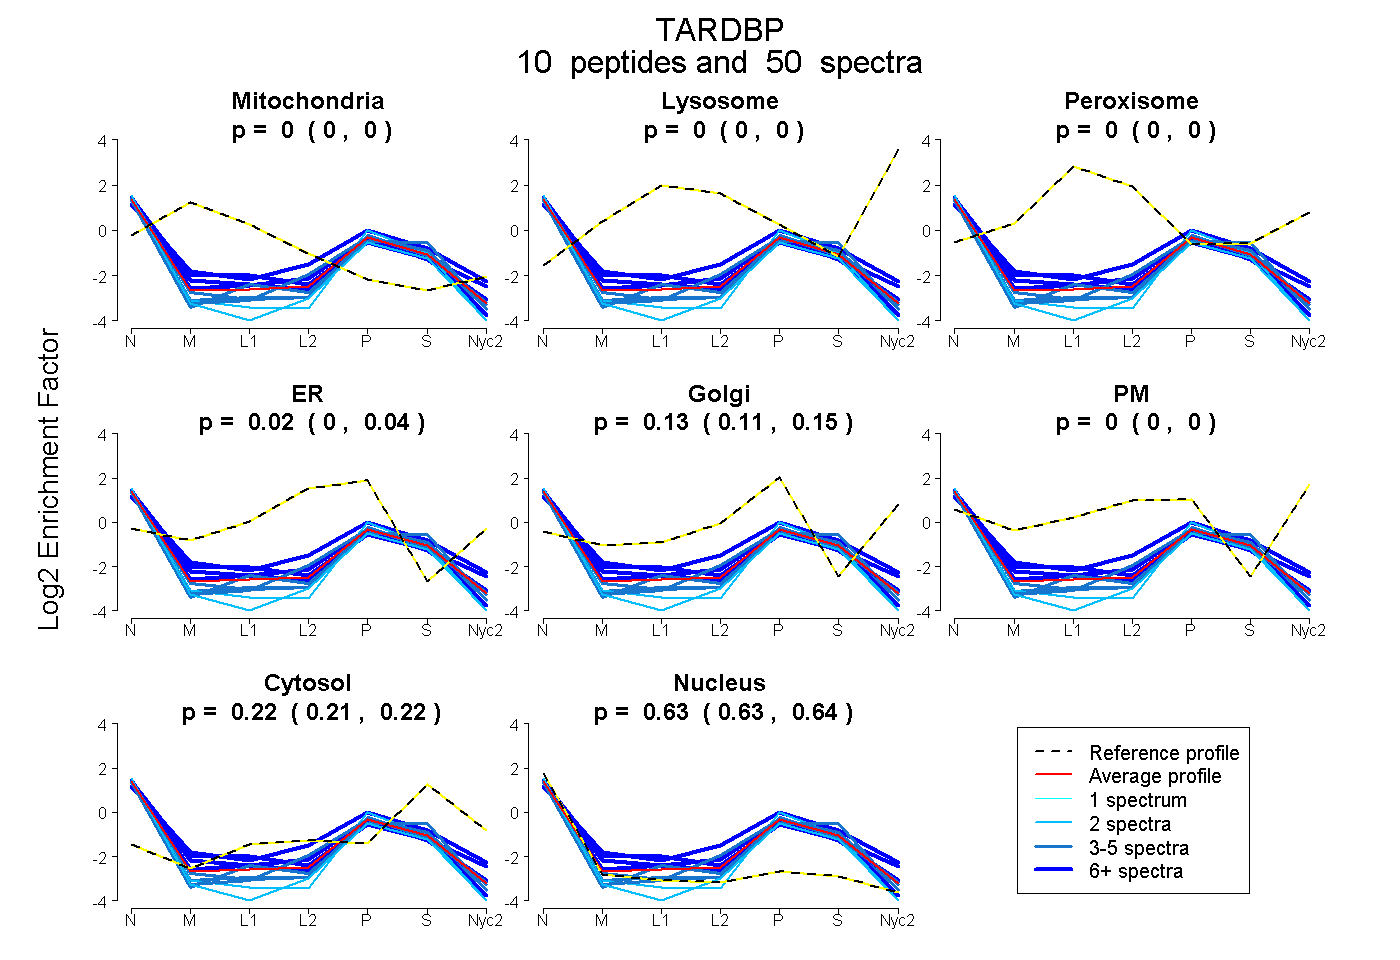
| Plot | Mito | Lyso | Perox | ER | Golgi | PM | Cytosol | Nucleus | |||||
| Expt A |
10 peptides |
50 spectra |
|
0.000 0.000 | 0.000 |
0.000 0.000 | 0.000 |
0.000 0.000 | 0.000 |
0.019 0.000 | 0.037 |
0.132 0.108 | 0.151 |
0.000 0.000 | 0.000 |
0.219 0.215 | 0.222 |
0.631 0.625 | 0.635 |
| 2 spectra, NPVSQCMR | 0.000 | 0.000 | 0.000 | 0.000 | 0.050 | 0.000 | 0.189 | 0.761 | ||
| 6 spectra, MDEADASSAVK | 0.000 | 0.000 | 0.000 | 0.137 | 0.060 | 0.000 | 0.183 | 0.620 | ||
| 3 spectra, TTEQDLK | 0.000 | 0.000 | 0.000 | 0.016 | 0.003 | 0.000 | 0.353 | 0.628 | ||
| 3 spectra, TSDLIVLGLPWK | 0.000 | 0.000 | 0.000 | 0.000 | 0.132 | 0.000 | 0.193 | 0.675 | ||
| 2 spectra, VAQSLCGEDLIIK | 0.000 | 0.000 | 0.000 | 0.000 | 0.016 | 0.000 | 0.169 | 0.816 | ||
| 4 spectra, QSPDEPLR | 0.000 | 0.000 | 0.000 | 0.086 | 0.027 | 0.000 | 0.261 | 0.626 | ||
| 5 spectra, AFAFVTFADDK | 0.000 | 0.000 | 0.000 | 0.000 | 0.099 | 0.000 | 0.208 | 0.694 | ||
| 13 spectra, GFGFVR | 0.000 | 0.000 | 0.000 | 0.127 | 0.000 | 0.000 | 0.198 | 0.674 | ||
| 6 spectra, HMIDGR | 0.000 | 0.000 | 0.000 | 0.164 | 0.146 | 0.000 | 0.257 | 0.434 | ||
| 6 spectra, FTEYETQVK | 0.000 | 0.000 | 0.000 | 0.010 | 0.233 | 0.000 | 0.194 | 0.562 |
| Plot | Mito | Lyso or Perox | ER | Golgi | PM | Cytosol | Nucleus | ||||||
| Expt B |
3 peptides |
5 spectra |
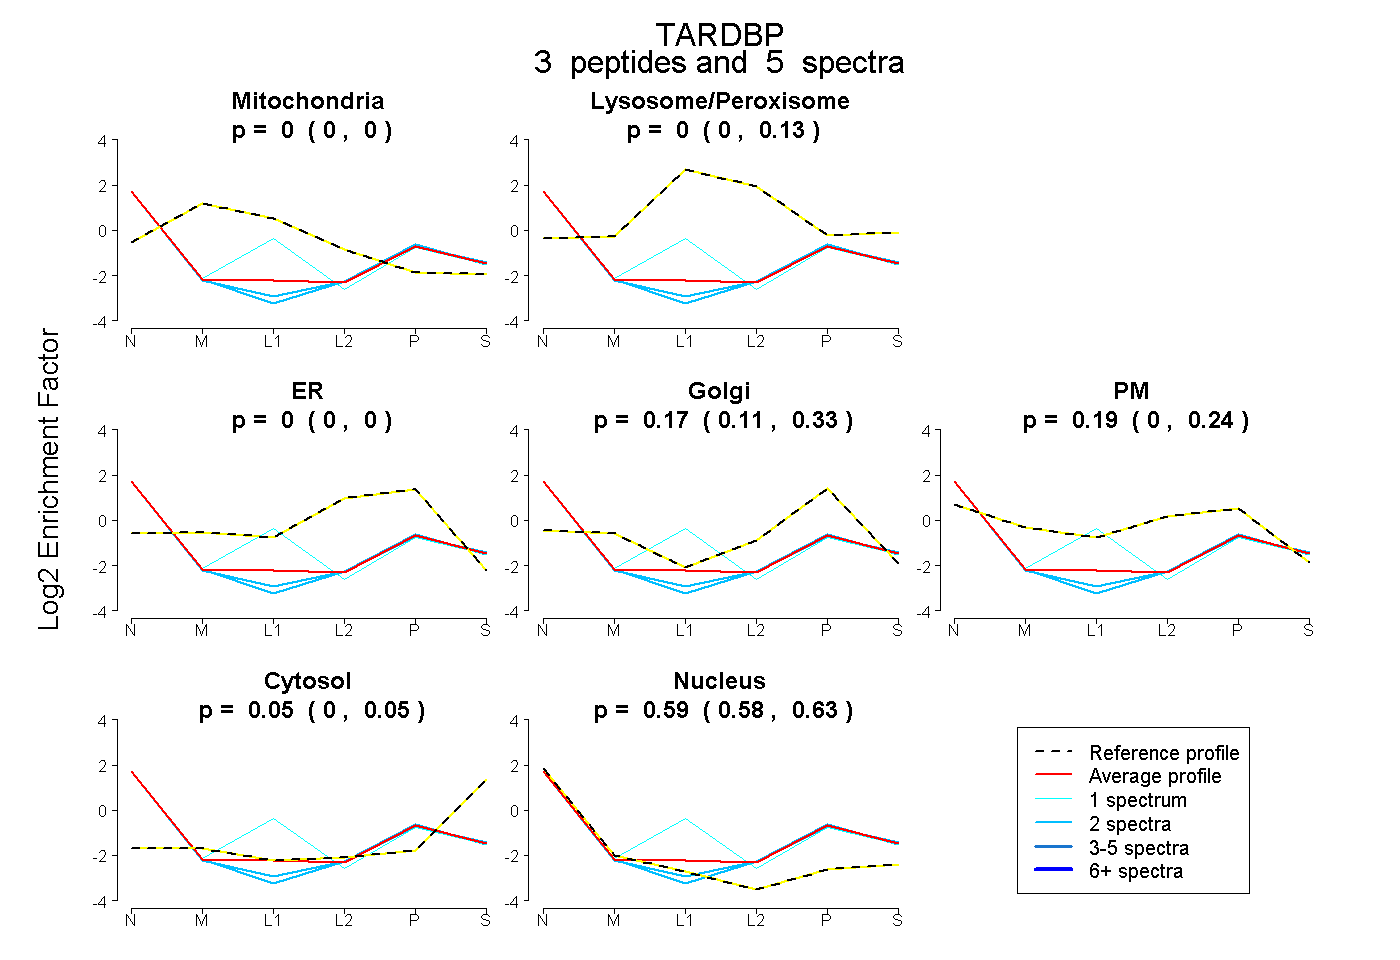 |
0.000 0.000 | 0.000 |
0.000 0.000 | 0.126 |
0.000 0.000 | 0.000 |
0.174 0.111 | 0.329 |
0.186 0.000 | 0.238 |
0.048 0.000 | 0.054 |
0.593 0.576 | 0.634 |
|||
| Plot | Lyso | Other | |||||||||||
| Expt C |
5 peptides |
15 spectra |
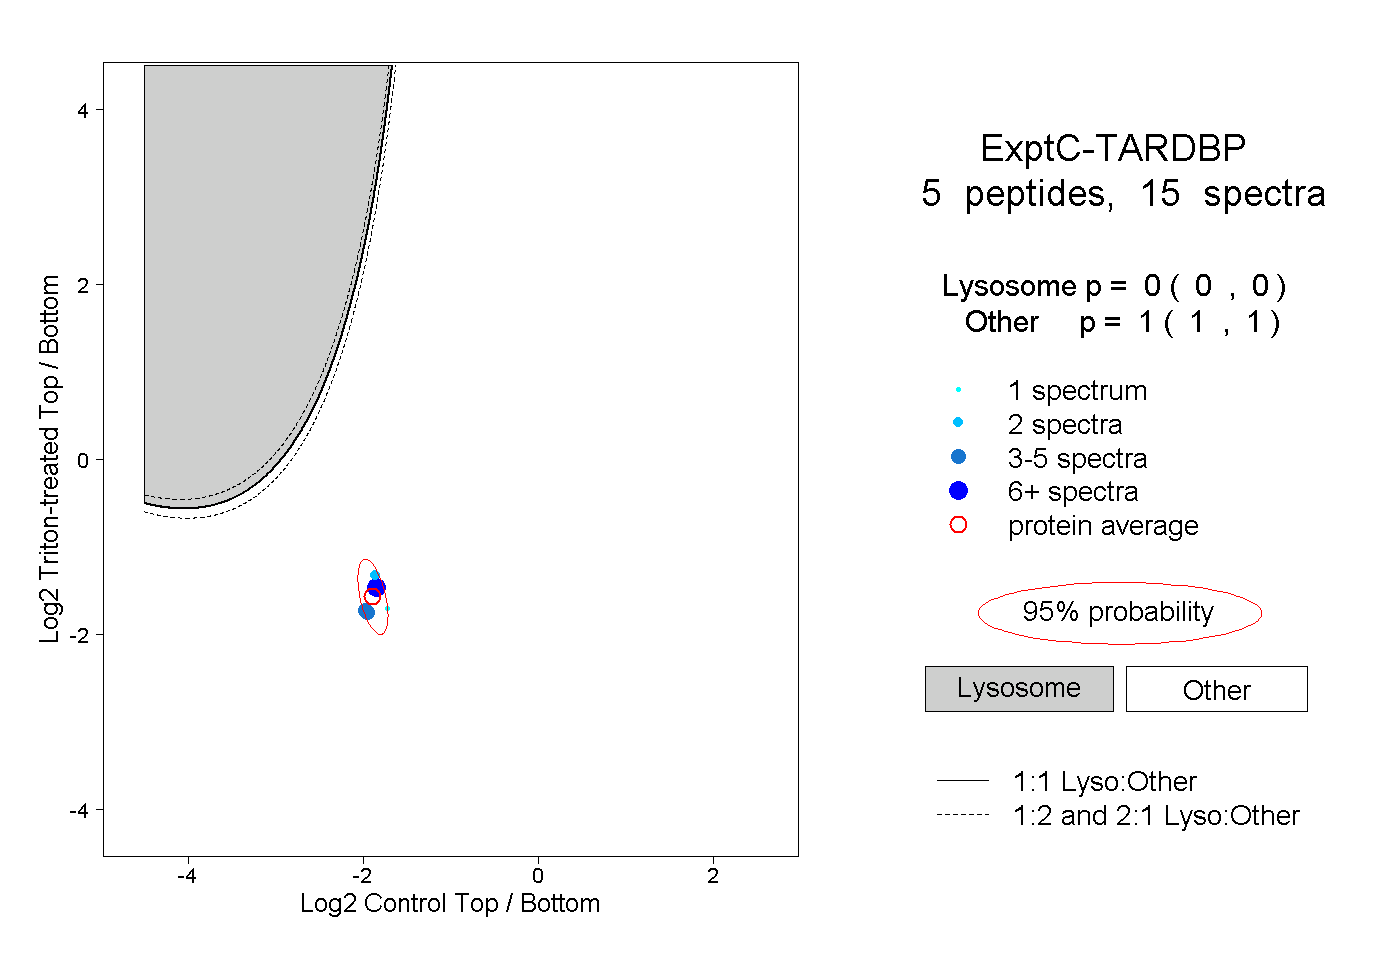 |
0.000 0.000 | 0.000 |
1.000 1.000 | 1.000 |
||||||||
| Plot | Lyso | Other | |||||||||||
| Expt D |
1 peptide |
1 spectrum |
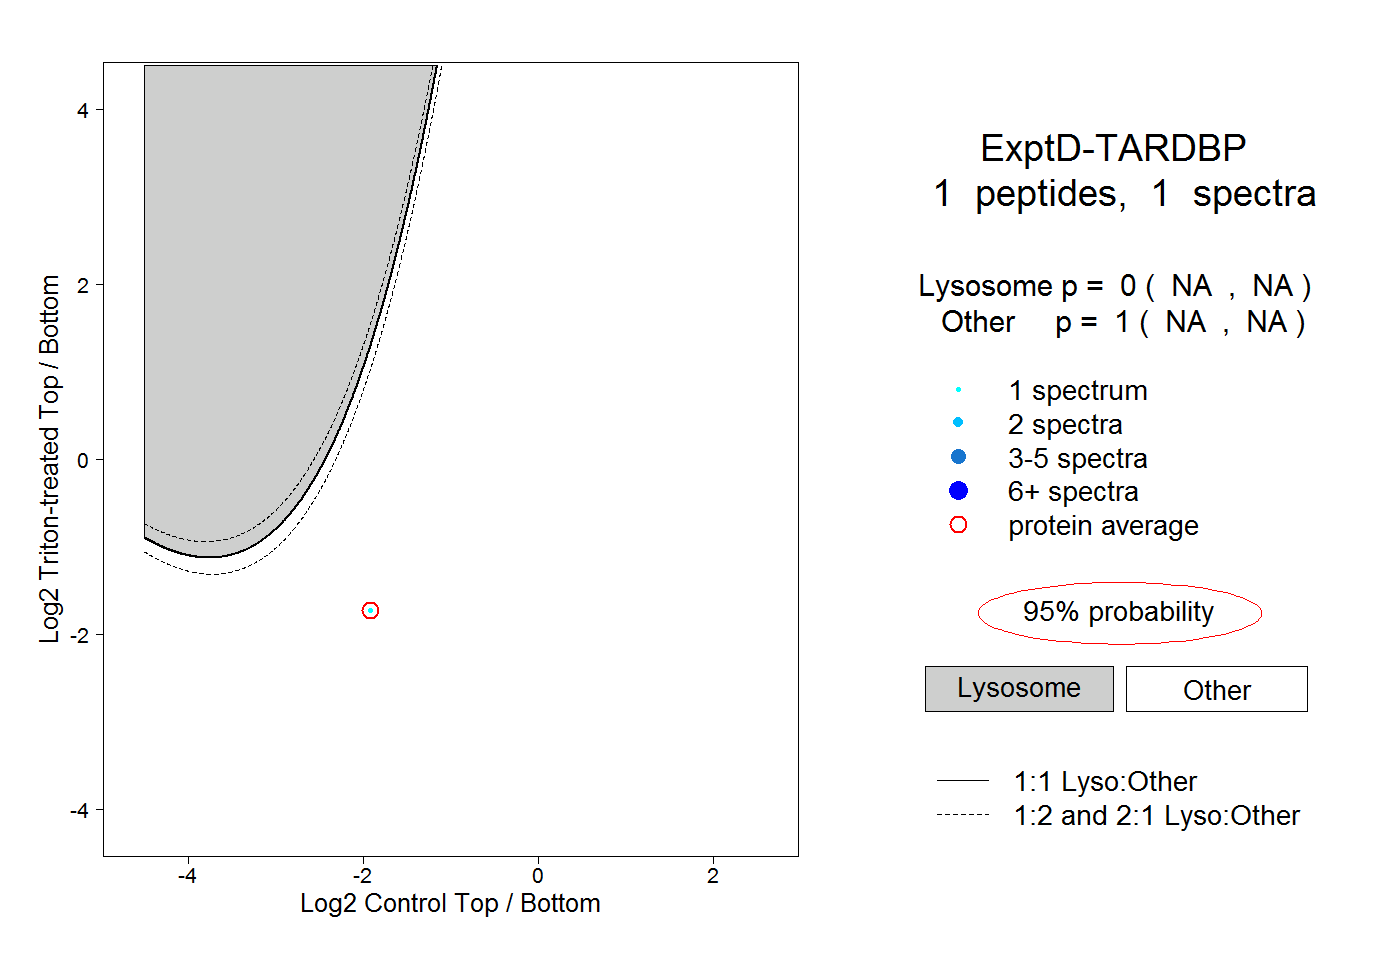 |
0.000 NA | NA |
1.000 NA | NA |