 7
7peptides
spectra
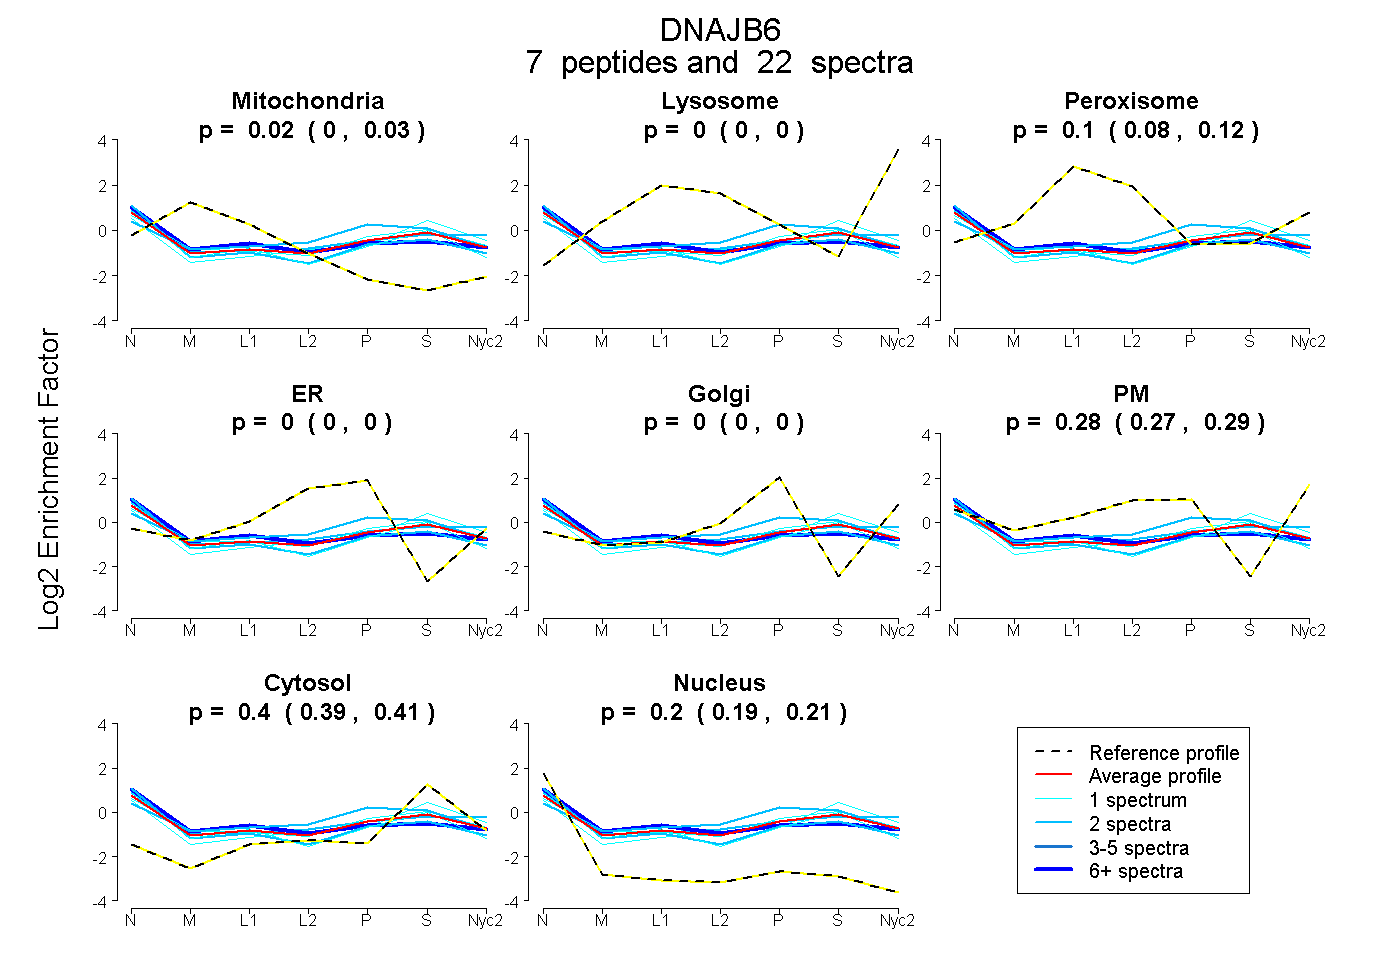
0.003 | 0.032
0.000 | 0.000
0.084 | 0.116
0.000 | 0.000
0.000 | 0.000
0.267 | 0.291
0.386 | 0.407
0.189 | 0.212
1peptide
spectrum
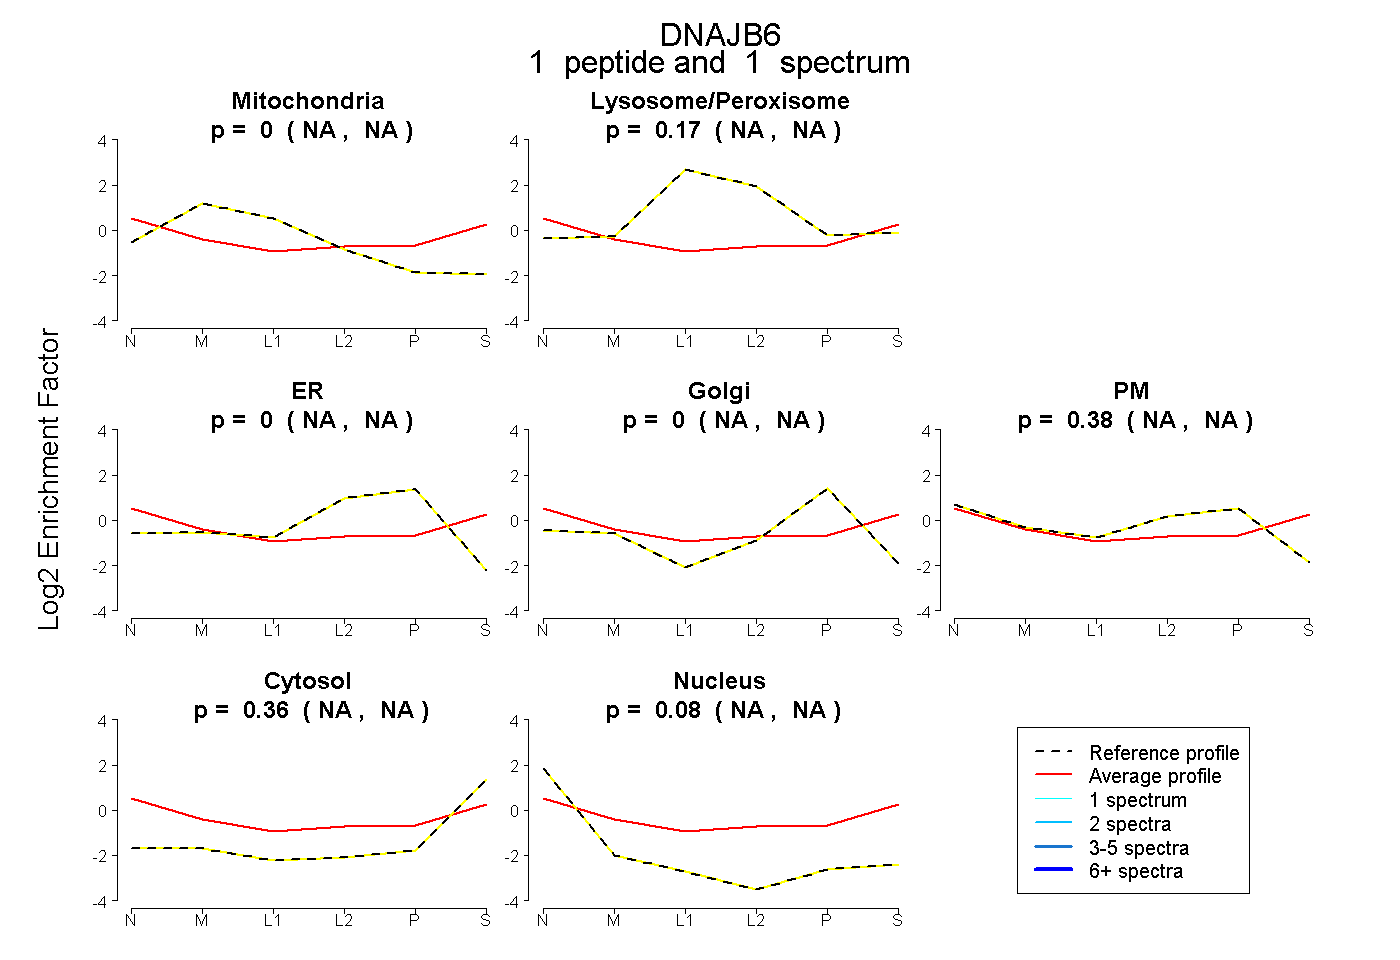
NA | NA
NA | NA
NA | NA
NA | NA
NA | NA
NA | NA
NA | NA
6peptides
spectra
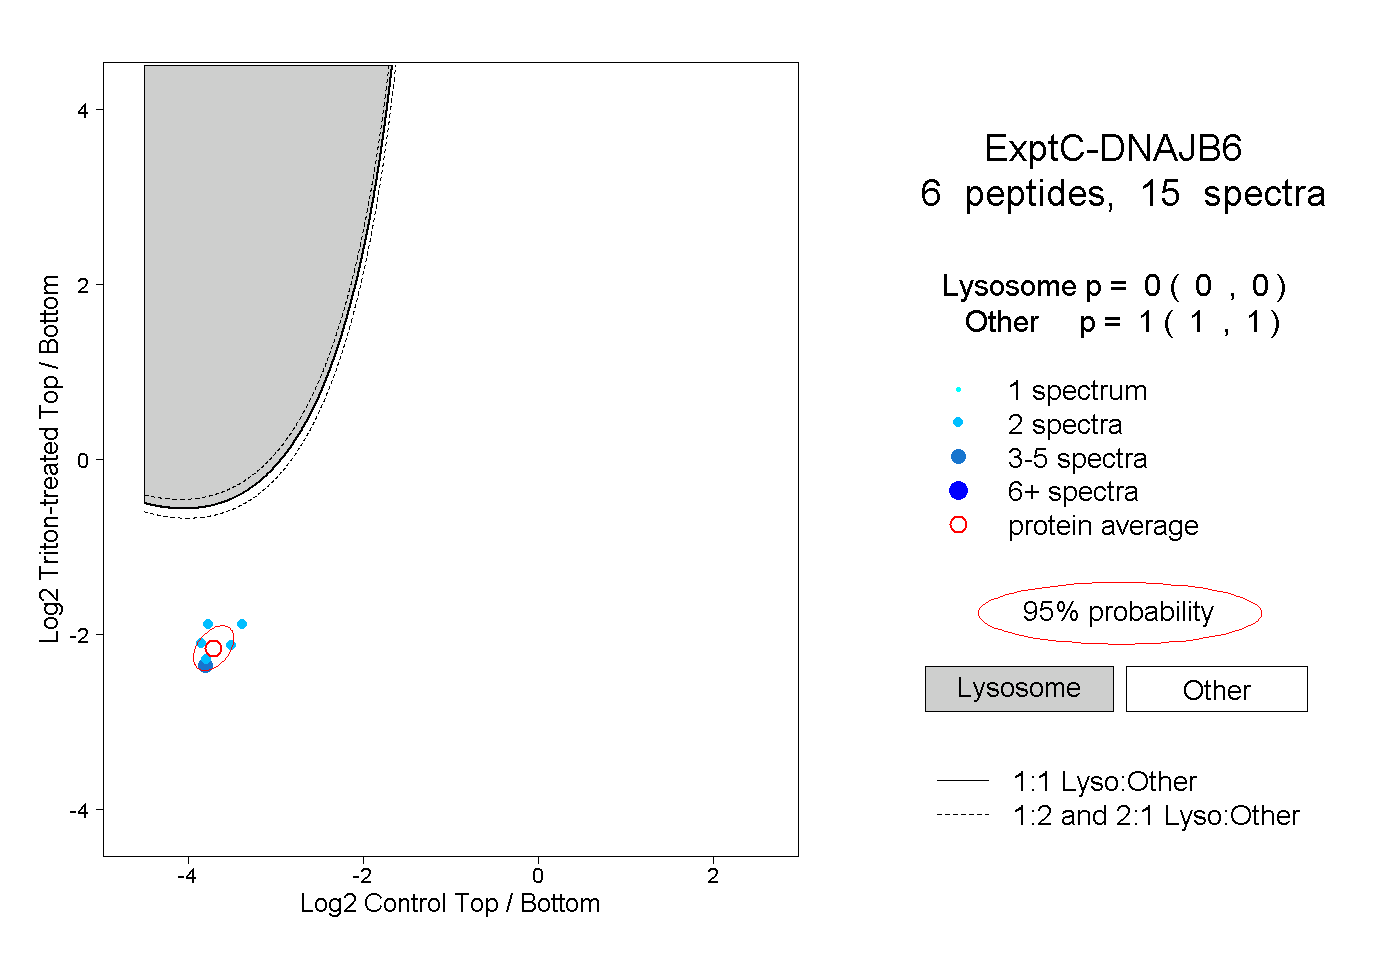
0.000 | 0.000
1.000 | 1.000