 7
7peptides
spectra
0.003 | 0.032
0.000 | 0.000
0.084 | 0.116
0.000 | 0.000
0.000 | 0.000
0.267 | 0.291
0.386 | 0.407
0.189 | 0.212
| Plot | Mito | Lyso | Perox | ER | Golgi | PM | Cytosol | Nucleus | |||||
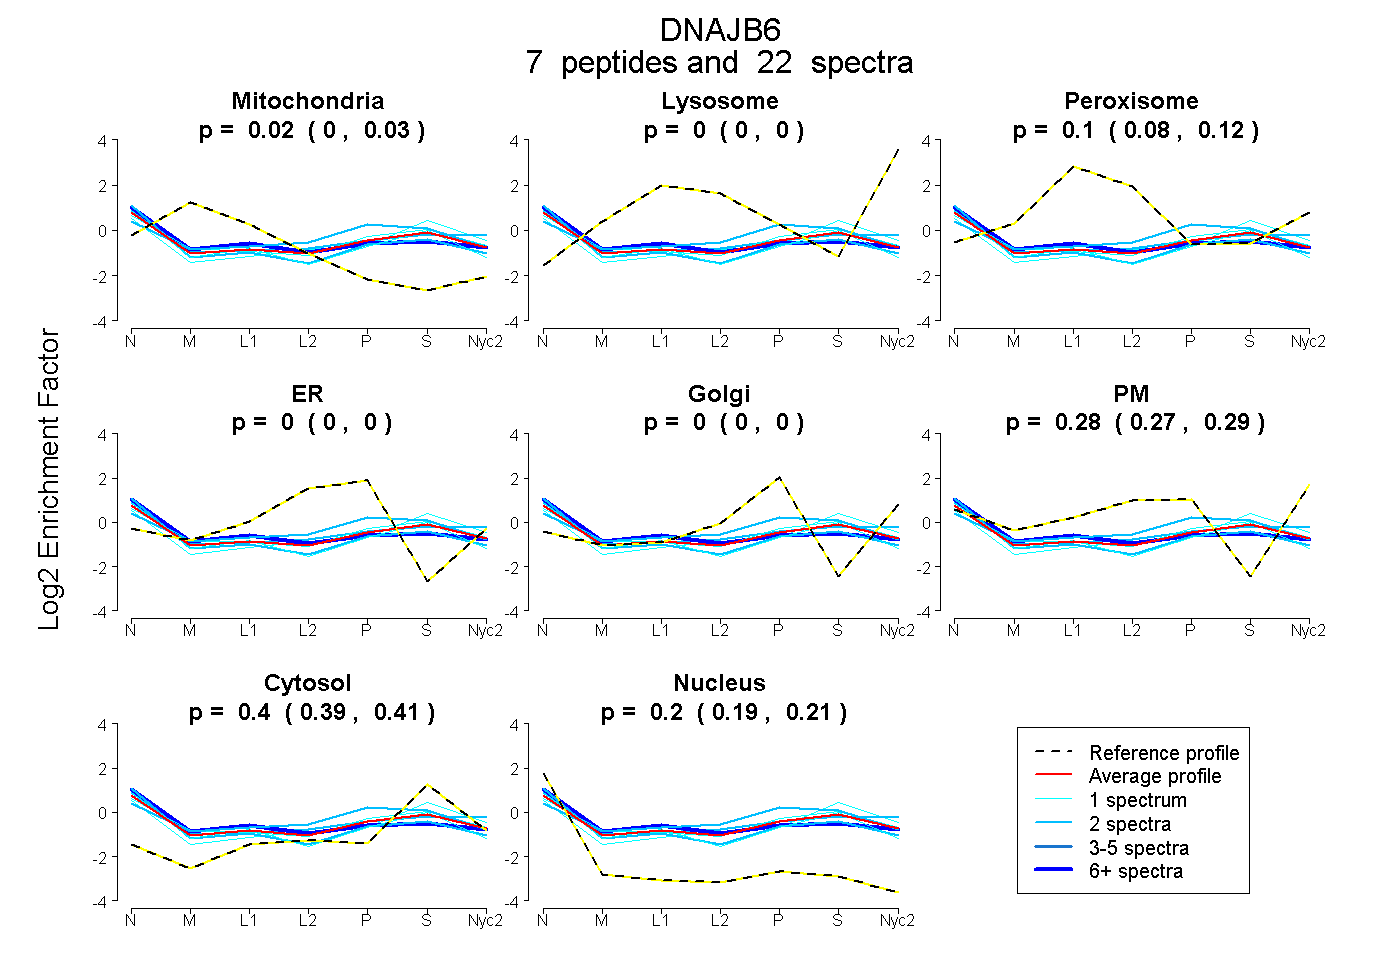
| Expt A |
7 peptides |
22 spectra |
|
0.019 0.003 | 0.032 |
0.000 0.000 | 0.000 |
0.102 0.084 | 0.116 |
0.000 0.000 | 0.000 |
0.000 0.000 | 0.000 |
0.280 0.267 | 0.291 |
0.397 0.386 | 0.407 |
0.202 0.189 | 0.212 |
| 2 spectra, QVAEAYEVLSDAK | 0.004 | 0.000 | 0.107 | 0.000 | 0.000 | 0.249 | 0.325 | 0.315 | ||
| 1 spectrum, VDYYEVLGVQR | 0.016 | 0.000 | 0.160 | 0.000 | 0.000 | 0.149 | 0.391 | 0.285 | ||
| 13 spectra, NPDDVFR | 0.022 | 0.000 | 0.191 | 0.000 | 0.000 | 0.257 | 0.260 | 0.270 | ||
| 2 spectra, IVENGQER | 0.000 | 0.000 | 0.064 | 0.000 | 0.000 | 0.382 | 0.385 | 0.169 | ||
| 1 spectrum, EFFGGR | 0.000 | 0.000 | 0.044 | 0.000 | 0.000 | 0.271 | 0.559 | 0.127 | ||
| 2 spectra, VEVEEDGQLK | 0.054 | 0.000 | 0.048 | 0.155 | 0.016 | 0.206 | 0.454 | 0.068 | ||
| 1 spectrum, SISTSTK | 0.105 | 0.000 | 0.000 | 0.000 | 0.000 | 0.328 | 0.457 | 0.109 |
| Plot | Mito | Lyso or Perox | ER | Golgi | PM | Cytosol | Nucleus | ||||||
| Expt B |
1 peptide |
1 spectrum |
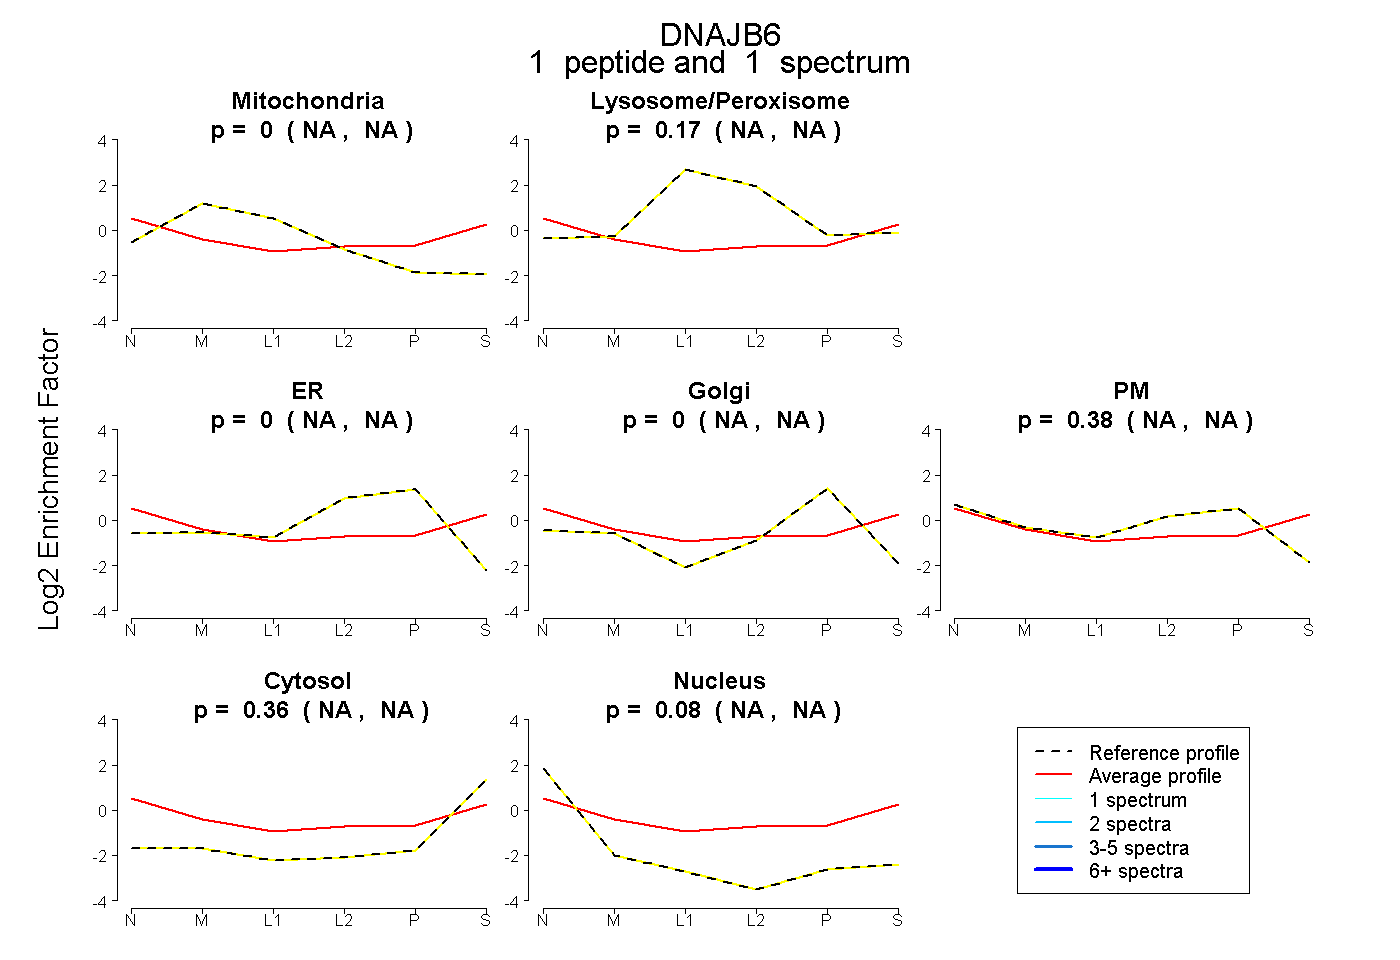 |
0.000 NA | NA |
0.173 NA | NA |
0.000 NA | NA |
0.000 NA | NA |
0.383 NA | NA |
0.361 NA | NA |
0.083 NA | NA |
|||
| Plot | Lyso | Other | |||||||||||
| Expt C |
6 peptides |
15 spectra |
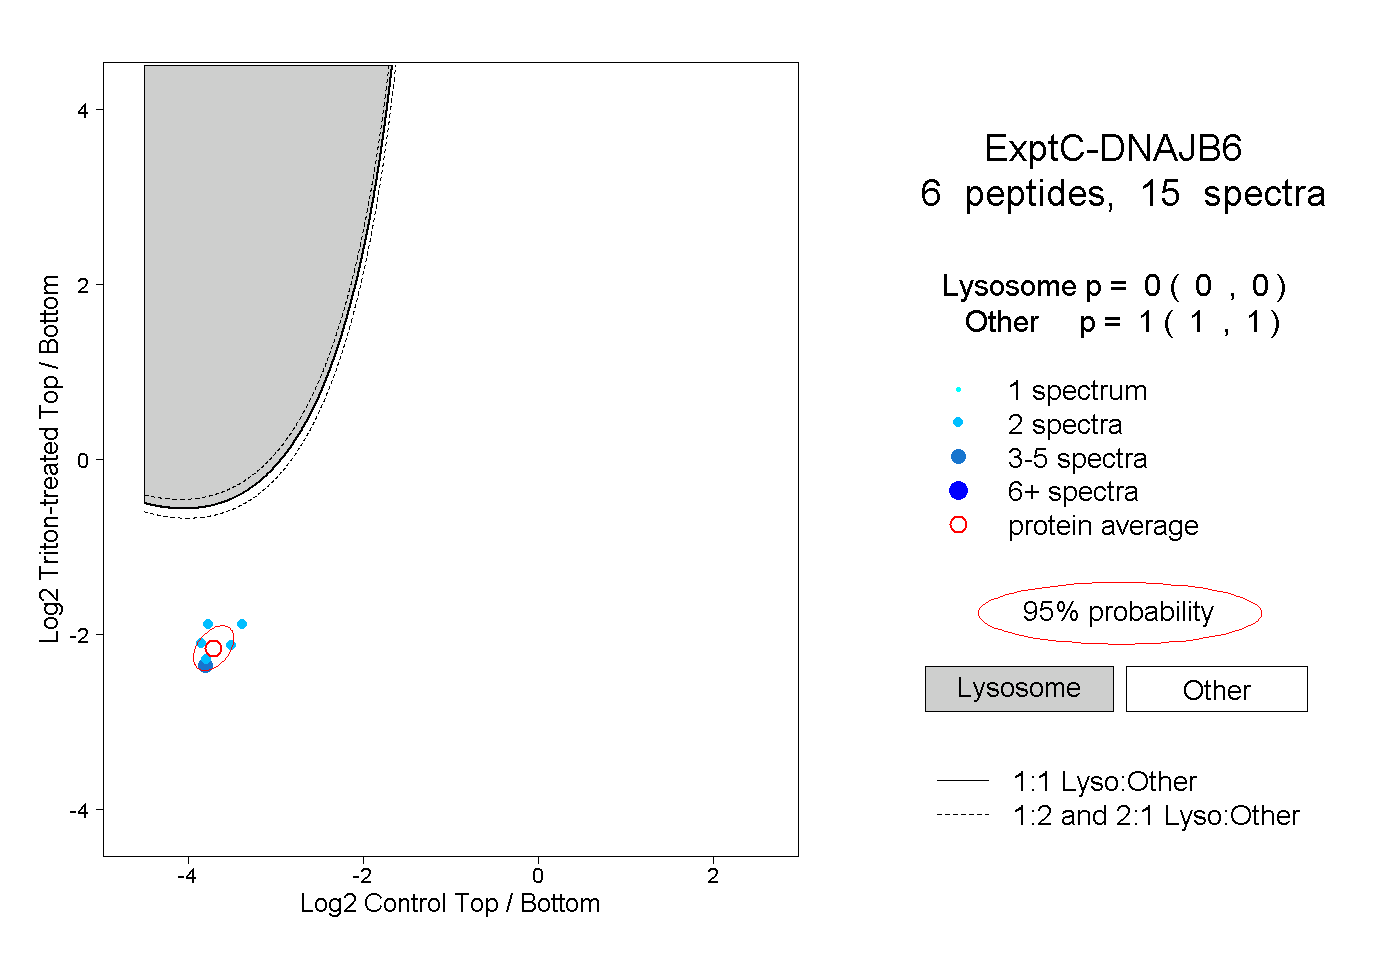 |
0.000 0.000 | 0.000 |
1.000 1.000 | 1.000 |