 15
15peptides
spectra
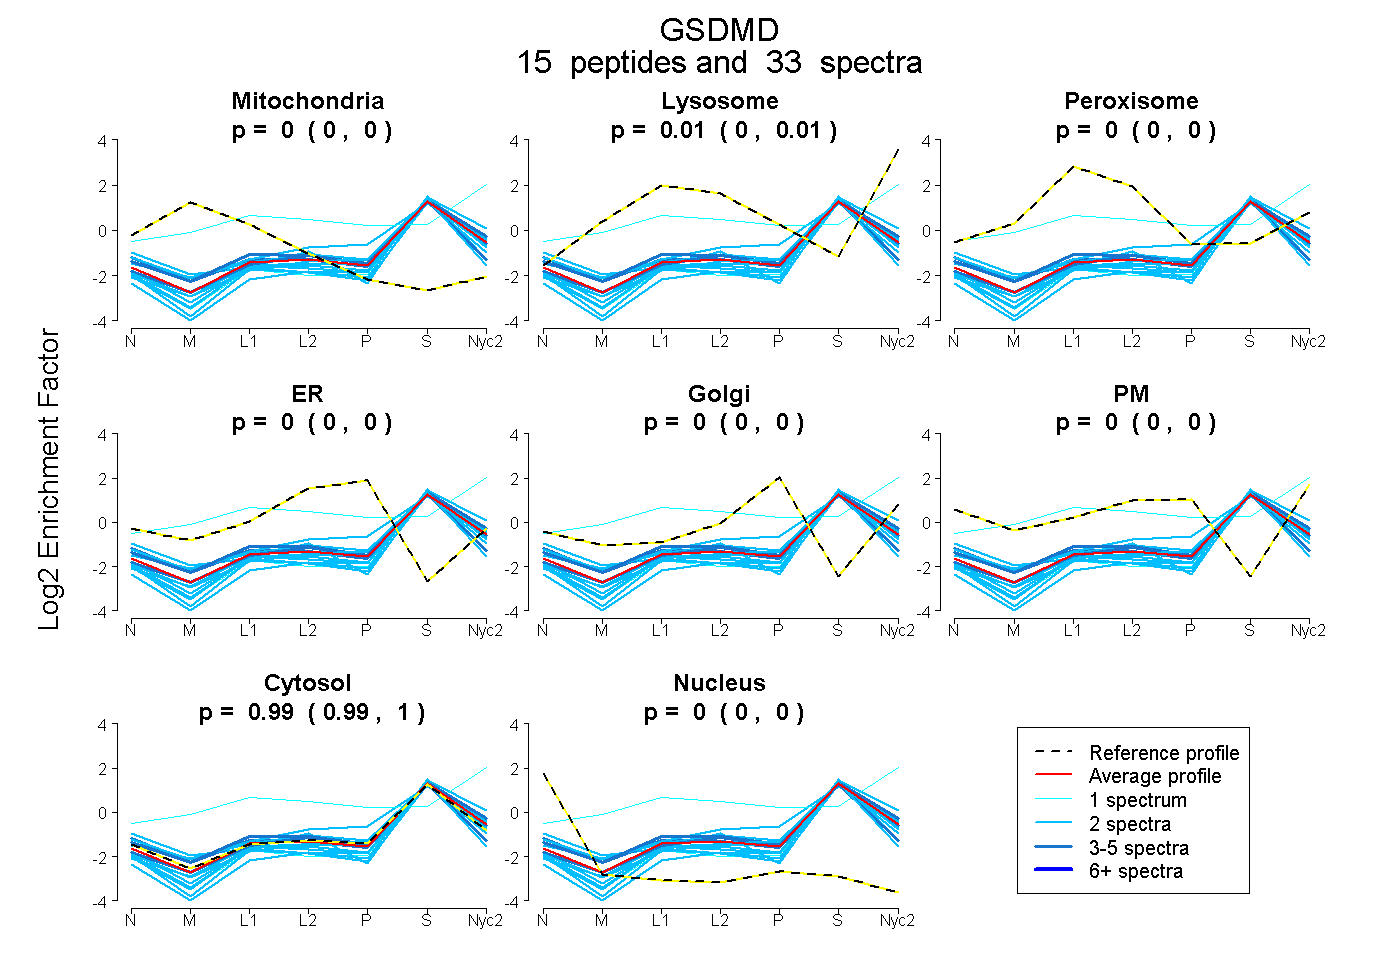
0.000 | 0.000
0.000 | 0.012
0.000 | 0.000
0.000 | 0.000
0.000 | 0.000
0.000 | 0.000
0.987 | 1.000
0.000 | 0.000
5peptides
spectra
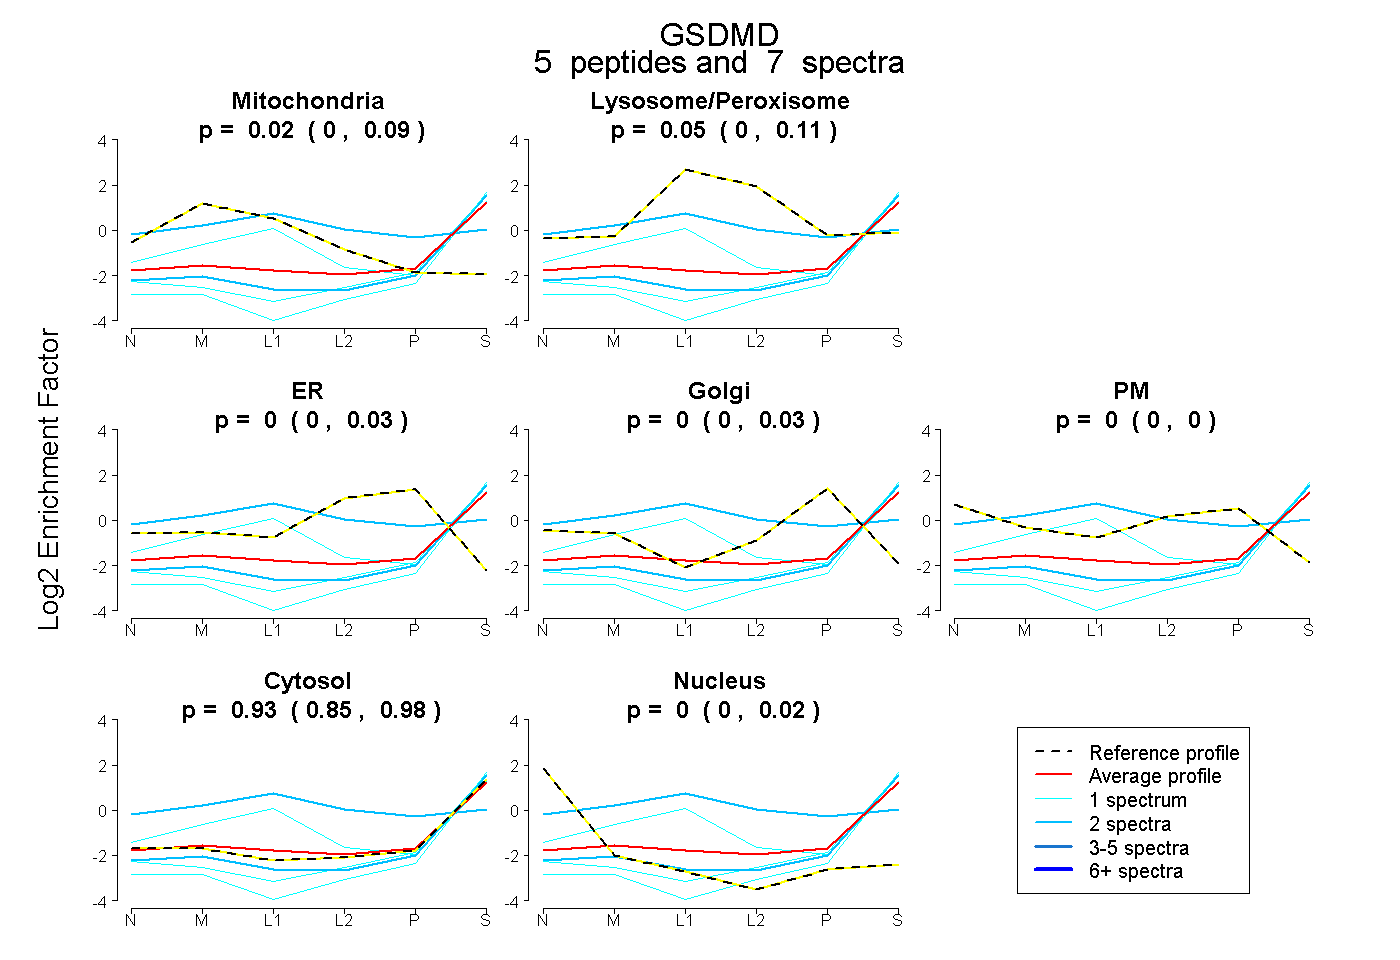
0.000 | 0.086
0.000 | 0.113
0.000 | 0.034
0.000 | 0.035
0.000 | 0.000
0.846 | 0.976
0.000 | 0.025
12peptides
spectra
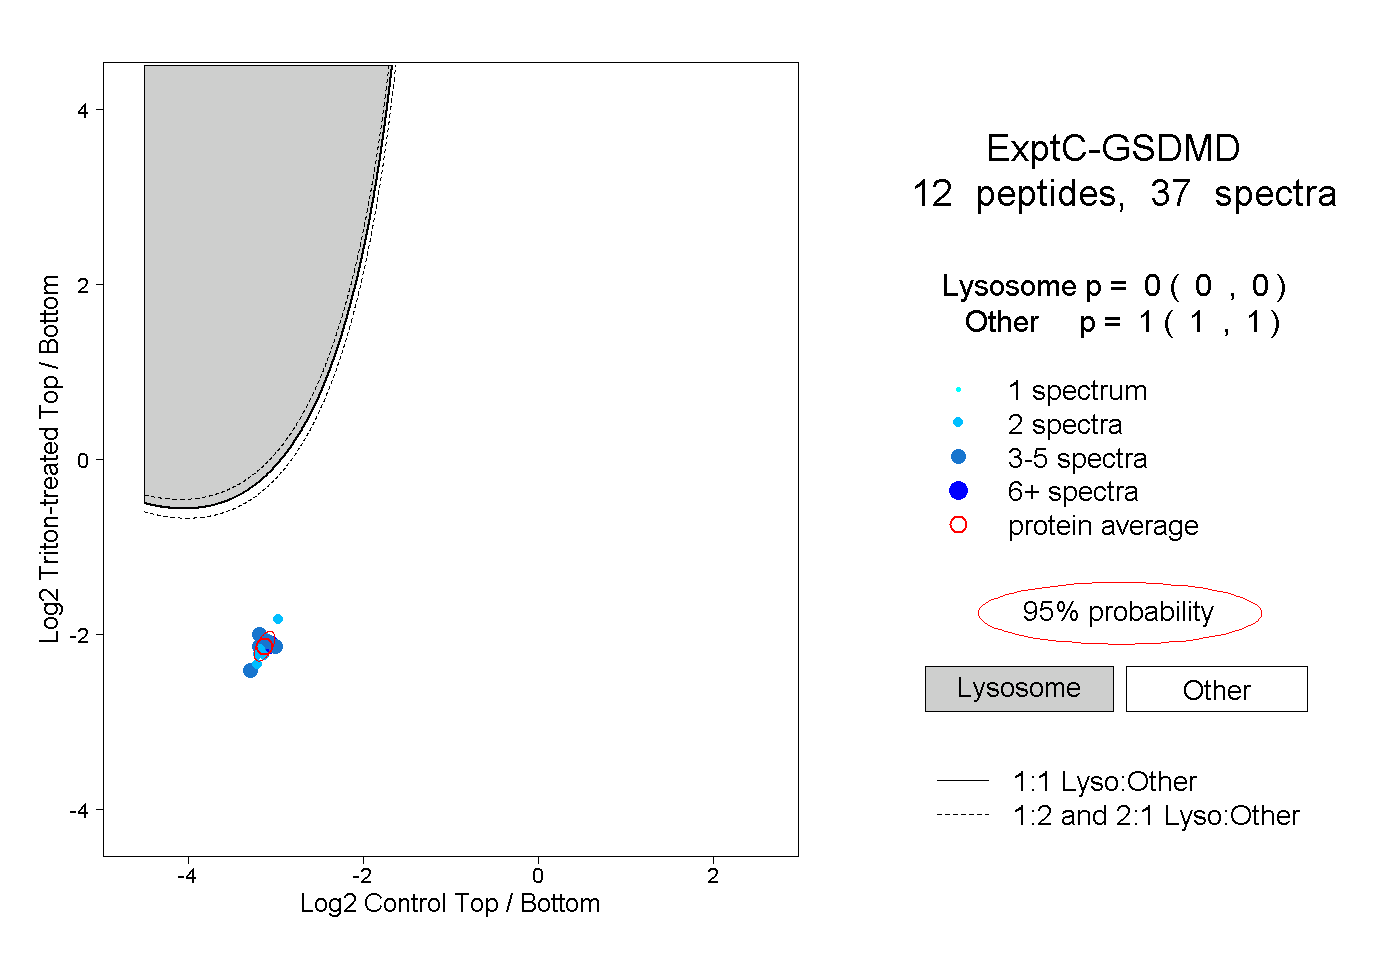
0.000 | 0.000
1.000 | 1.000
1peptide
spectra
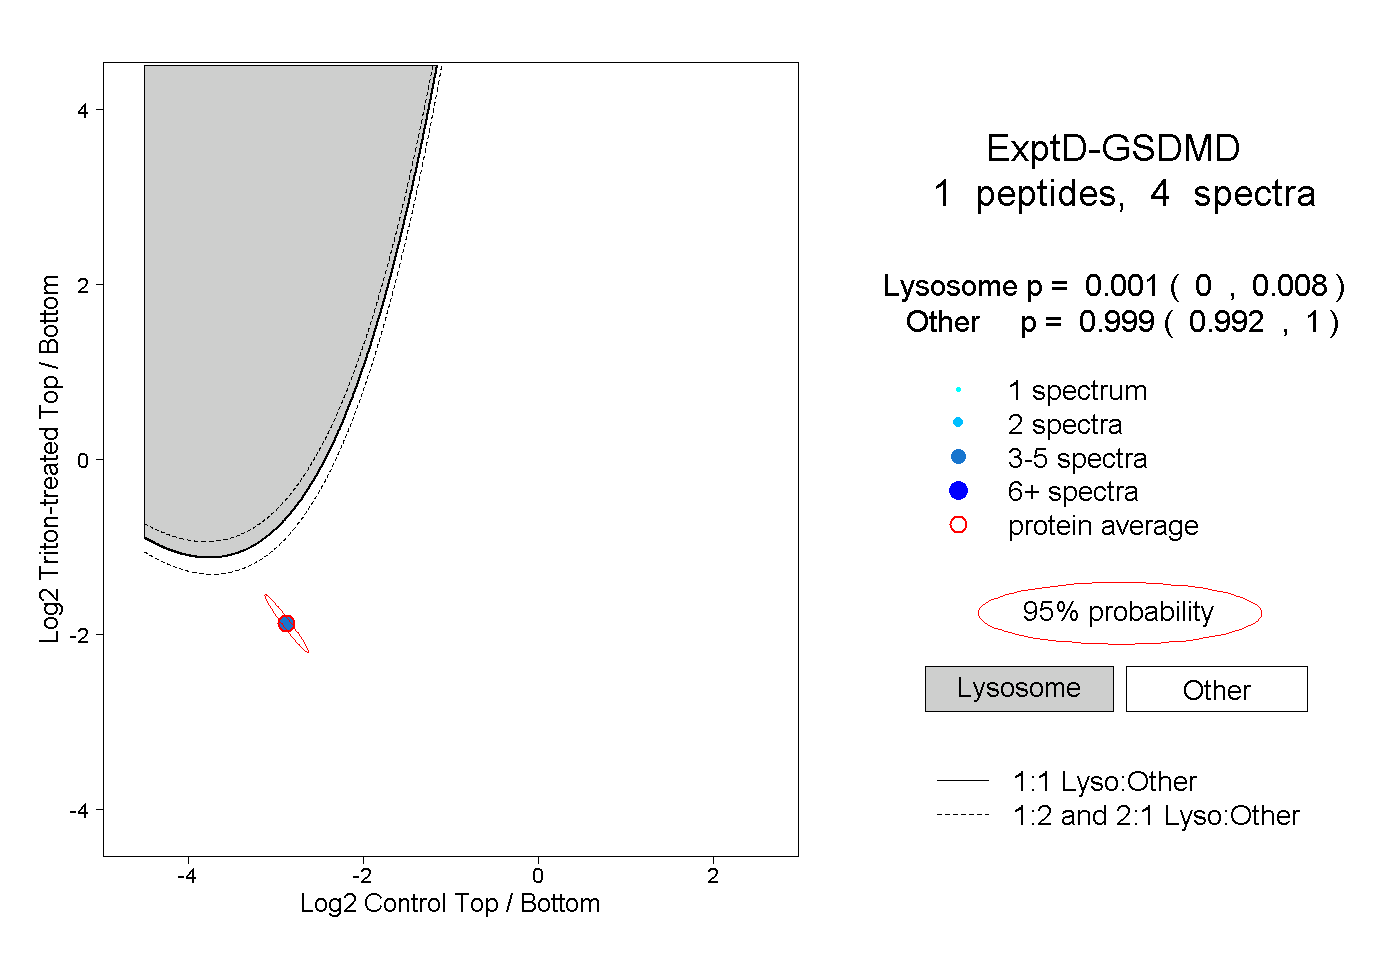
0.000 | 0.008
0.992 | 1.000