 15
15peptides
spectra
0.000 | 0.000
0.000 | 0.012
0.000 | 0.000
0.000 | 0.000
0.000 | 0.000
0.000 | 0.000
0.987 | 1.000
0.000 | 0.000
| Plot | Mito | Lyso | Perox | ER | Golgi | PM | Cytosol | Nucleus | |||||
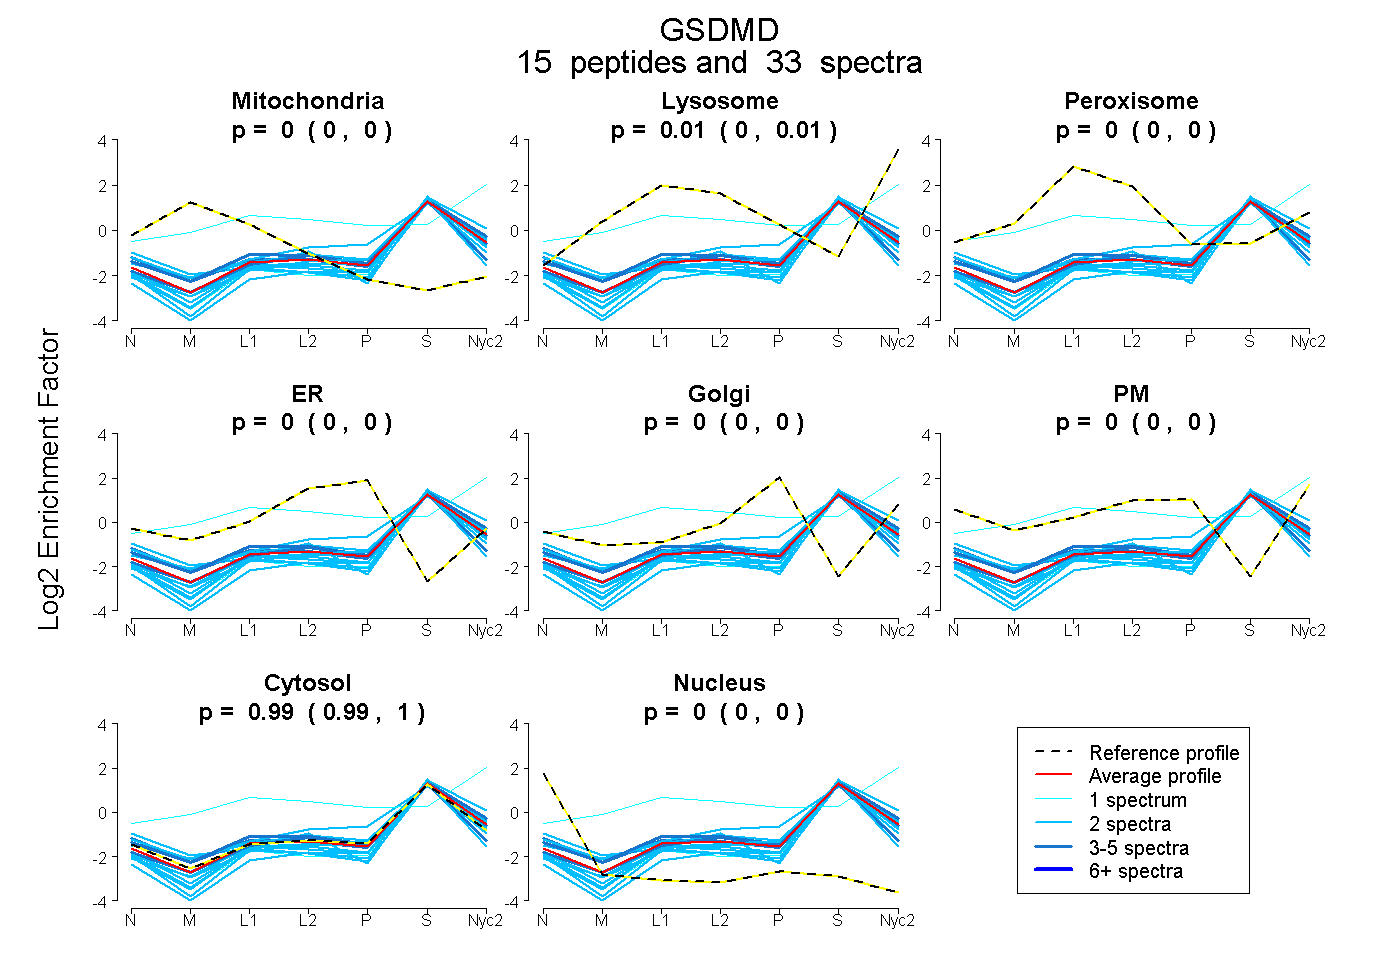
| Expt A |
15 peptides |
33 spectra |
|
0.000 0.000 | 0.000 |
0.006 0.000 | 0.012 |
0.000 0.000 | 0.000 |
0.000 0.000 | 0.000 |
0.000 0.000 | 0.000 |
0.000 0.000 | 0.000 |
0.994 0.987 | 1.000 |
0.000 0.000 | 0.000 |
| 4 spectra, ELELVK | 0.024 | 0.015 | 0.013 | 0.000 | 0.000 | 0.000 | 0.948 | 0.000 | ||
| 2 spectra, GAVGQR | 0.000 | 0.000 | 0.000 | 0.000 | 0.000 | 0.000 | 0.970 | 0.030 | ||
| 4 spectra, NSTSFKPYCLLSR | 0.050 | 0.000 | 0.020 | 0.000 | 0.000 | 0.000 | 0.929 | 0.000 | ||
| 2 spectra, QQLLVDIGR | 0.000 | 0.000 | 0.000 | 0.000 | 0.000 | 0.000 | 1.000 | 0.000 | ||
| 2 spectra, MVTIPAGSILAFR | 0.000 | 0.000 | 0.000 | 0.000 | 0.000 | 0.000 | 1.000 | 0.000 | ||
| 1 spectrum, HVLEQSTPWQEQR | 0.000 | 0.487 | 0.065 | 0.000 | 0.000 | 0.152 | 0.296 | 0.000 | ||
| 2 spectra, HLQQPENK | 0.000 | 0.068 | 0.000 | 0.000 | 0.092 | 0.000 | 0.840 | 0.000 | ||
| 1 spectrum, AEVEAGSSELR | 0.000 | 0.000 | 0.000 | 0.000 | 0.000 | 0.000 | 1.000 | 0.000 | ||
| 2 spectra, YTCVNLSIK | 0.000 | 0.000 | 0.000 | 0.000 | 0.000 | 0.000 | 0.982 | 0.018 | ||
| 2 spectra, SVPLPSR | 0.000 | 0.000 | 0.000 | 0.000 | 0.000 | 0.000 | 1.000 | 0.000 | ||
| 2 spectra, HDFSLLAVLHSIGER | 0.000 | 0.000 | 0.000 | 0.000 | 0.000 | 0.000 | 1.000 | 0.000 | ||
| 2 spectra, SDGTNEEEVIR | 0.000 | 0.000 | 0.000 | 0.000 | 0.000 | 0.000 | 1.000 | 0.000 | ||
| 2 spectra, LSSSWFWKPR | 0.014 | 0.042 | 0.000 | 0.000 | 0.000 | 0.000 | 0.944 | 0.000 | ||
| 3 spectra, VTQQTWEIMQR | 0.000 | 0.032 | 0.000 | 0.000 | 0.000 | 0.000 | 0.968 | 0.000 | ||
| 2 spectra, ALEATVLSK | 0.046 | 0.000 | 0.000 | 0.000 | 0.000 | 0.000 | 0.877 | 0.076 |
| Plot | Mito | Lyso or Perox | ER | Golgi | PM | Cytosol | Nucleus | ||||||
| Expt B |
5 peptides |
7 spectra |
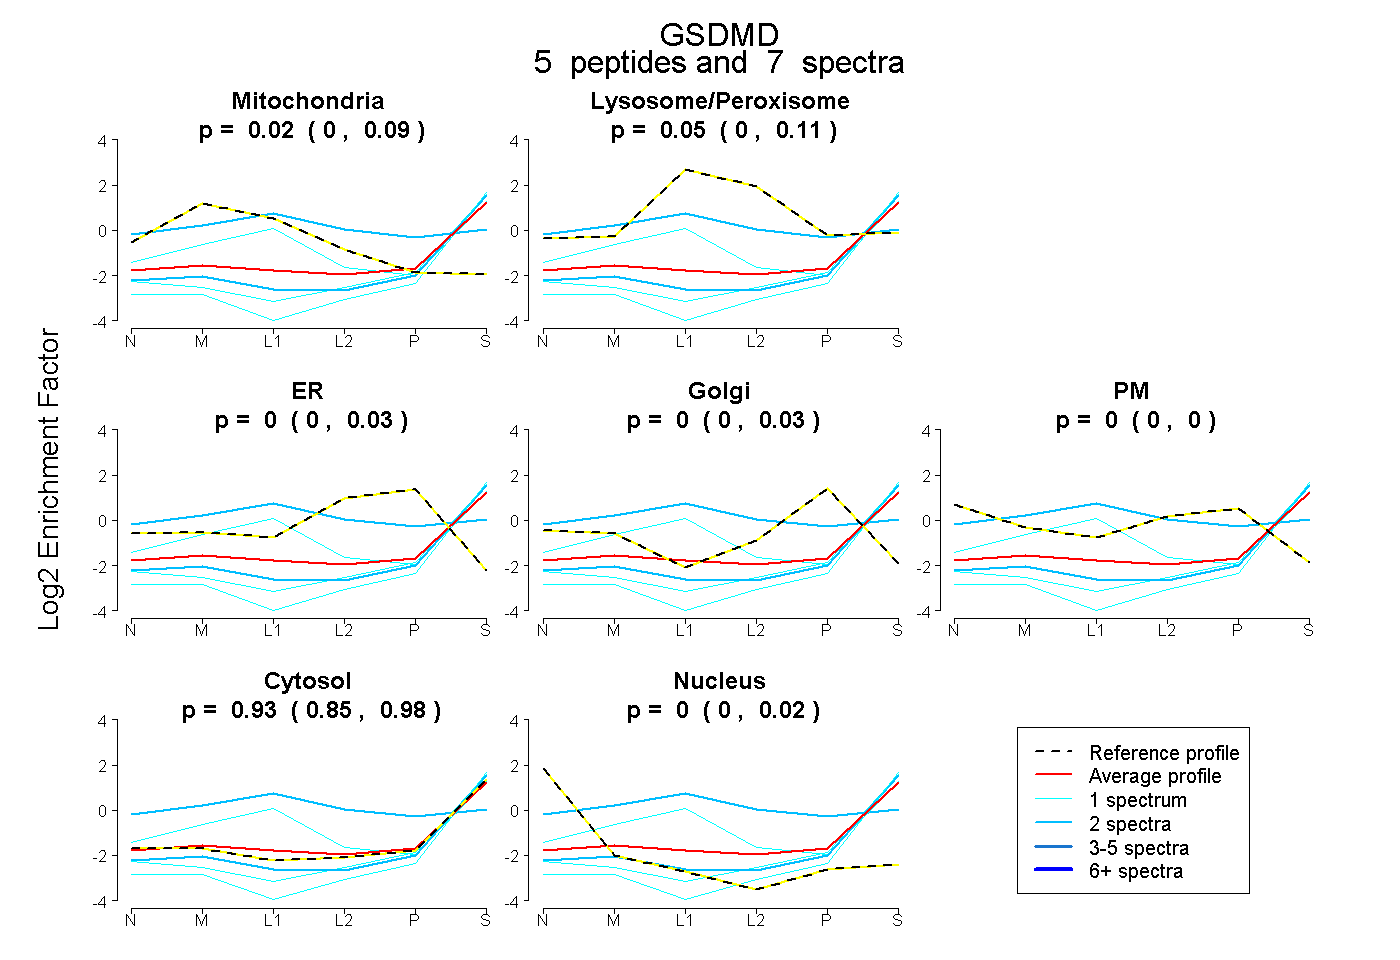 |
0.024 0.000 | 0.086 |
0.048 0.000 | 0.113 |
0.000 0.000 | 0.034 |
0.000 0.000 | 0.035 |
0.000 0.000 | 0.000 |
0.929 0.846 | 0.976 |
0.000 0.000 | 0.025 |
|||
| Plot | Lyso | Other | |||||||||||
| Expt C |
12 peptides |
37 spectra |
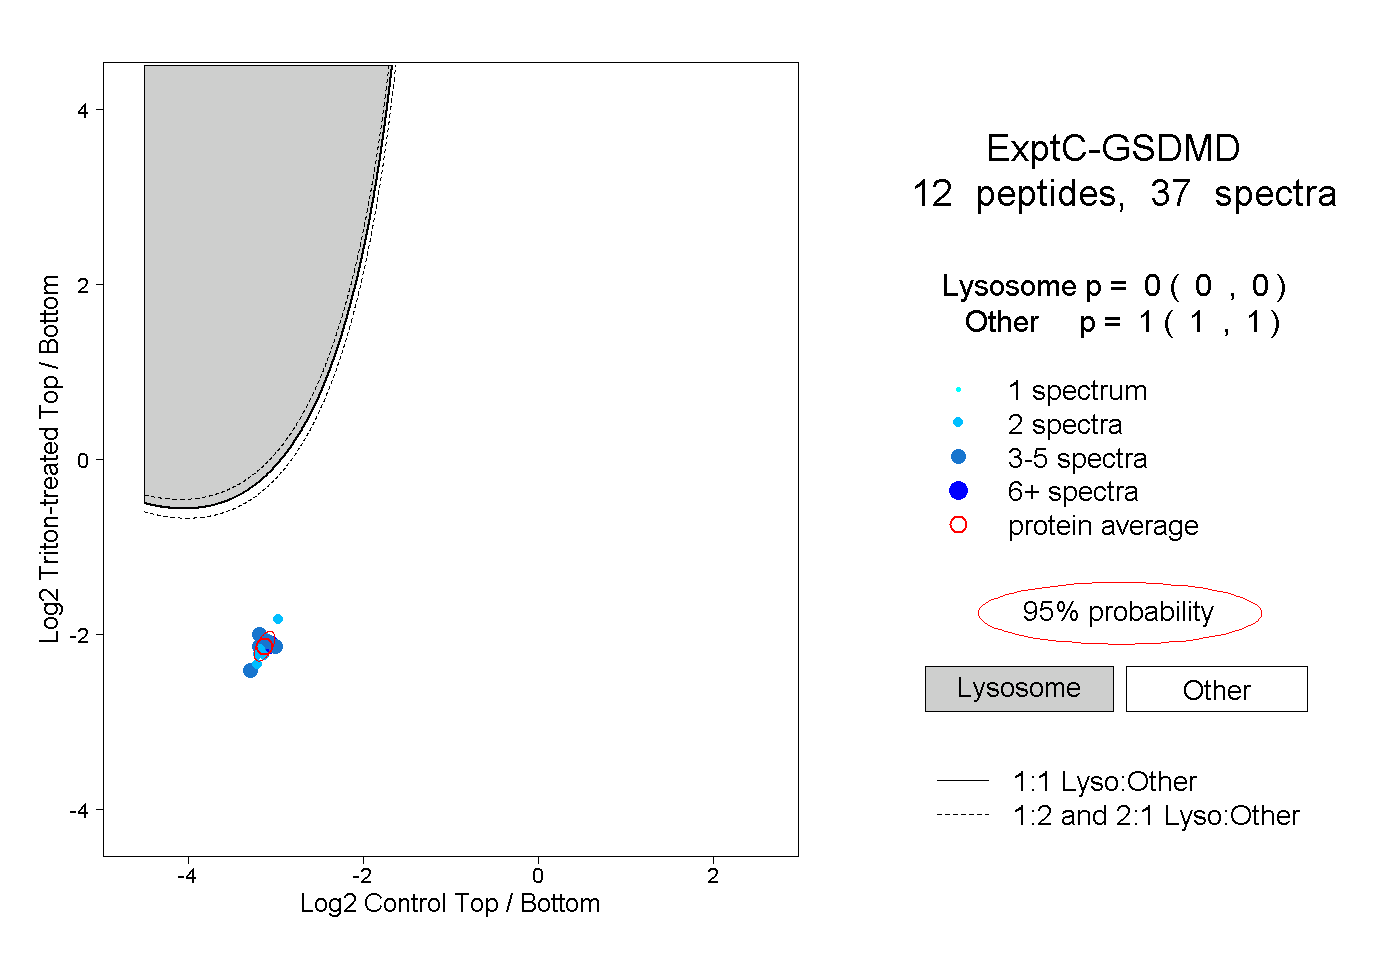 |
0.000 0.000 | 0.000 |
1.000 1.000 | 1.000 |
||||||||
| Plot | Lyso | Other | |||||||||||
| Expt D |
1 peptide |
4 spectra |
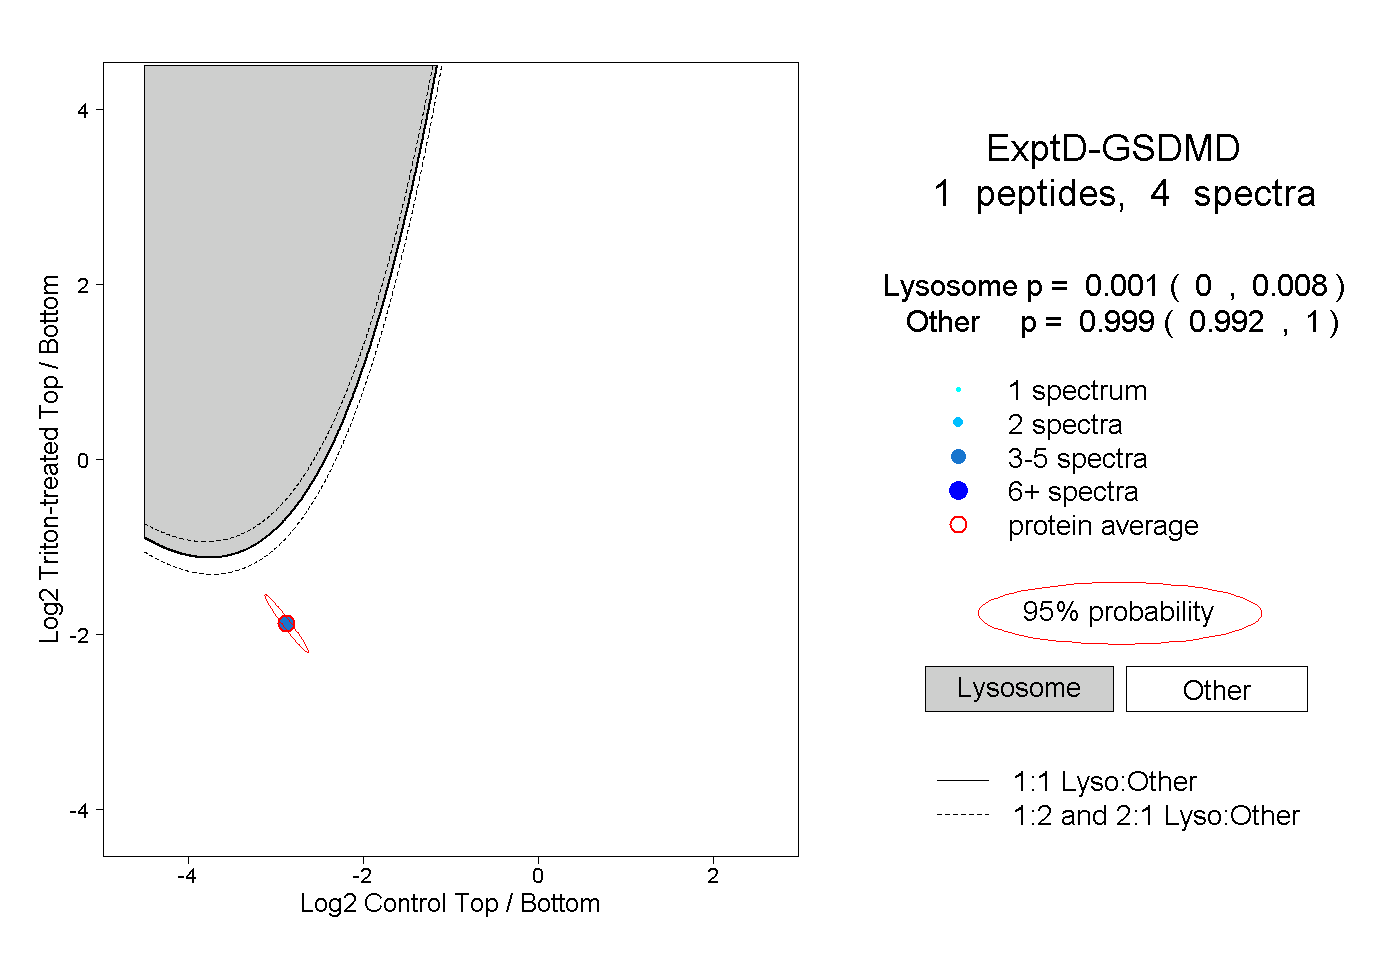 |
0.001 0.000 | 0.008 |
0.999 0.992 | 1.000 |