 6
6peptides
spectra
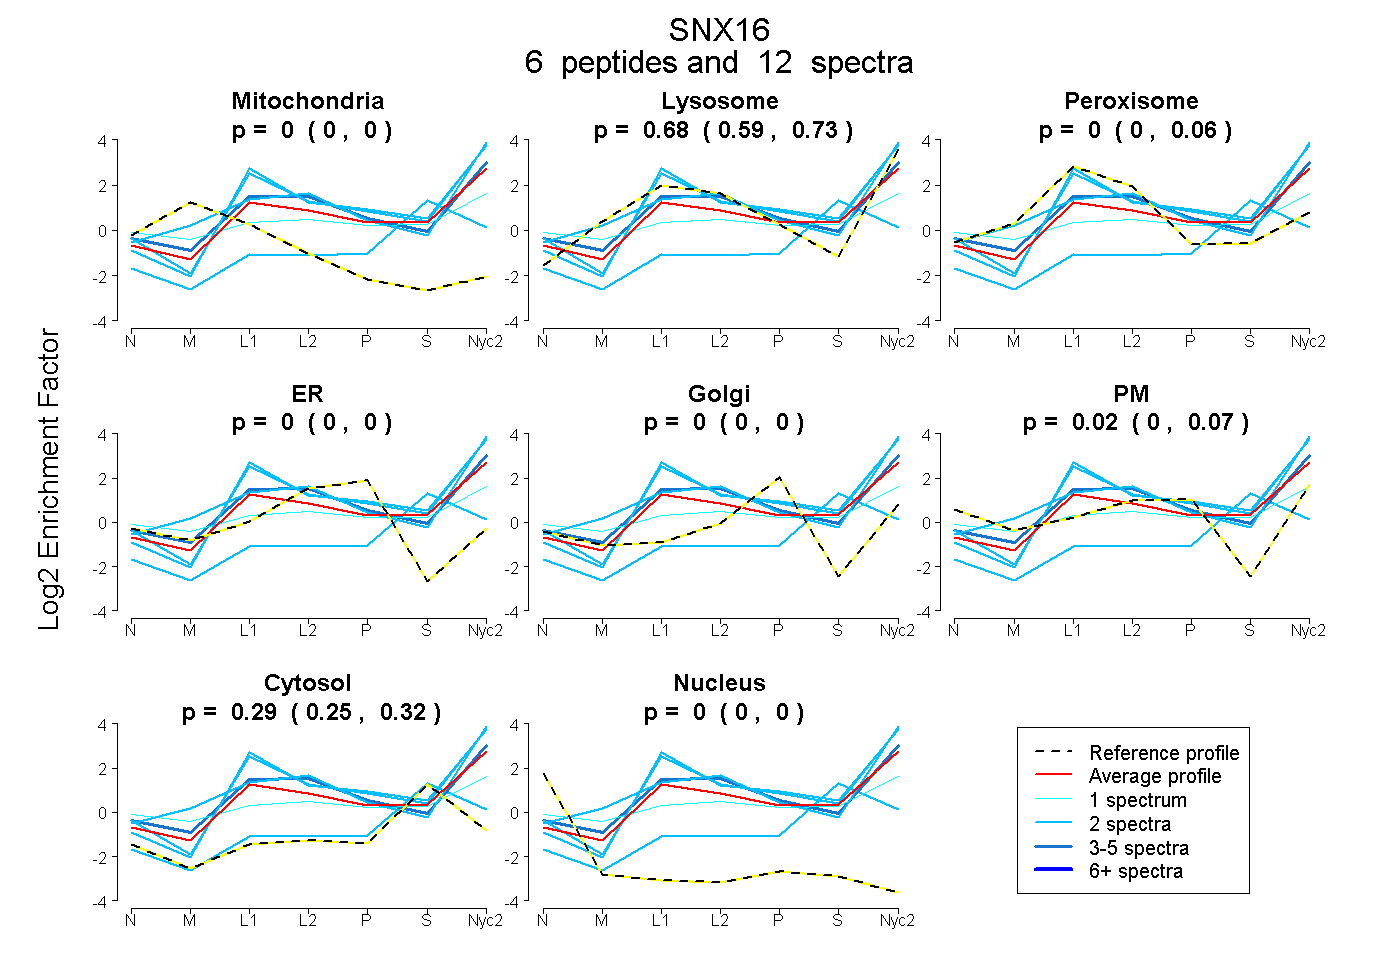
0.000 | 0.000
0.593 | 0.730
0.000 | 0.061
0.000 | 0.000
0.000 | 0.000
0.000 | 0.067
0.252 | 0.320
0.000 | 0.000
10peptides
spectra
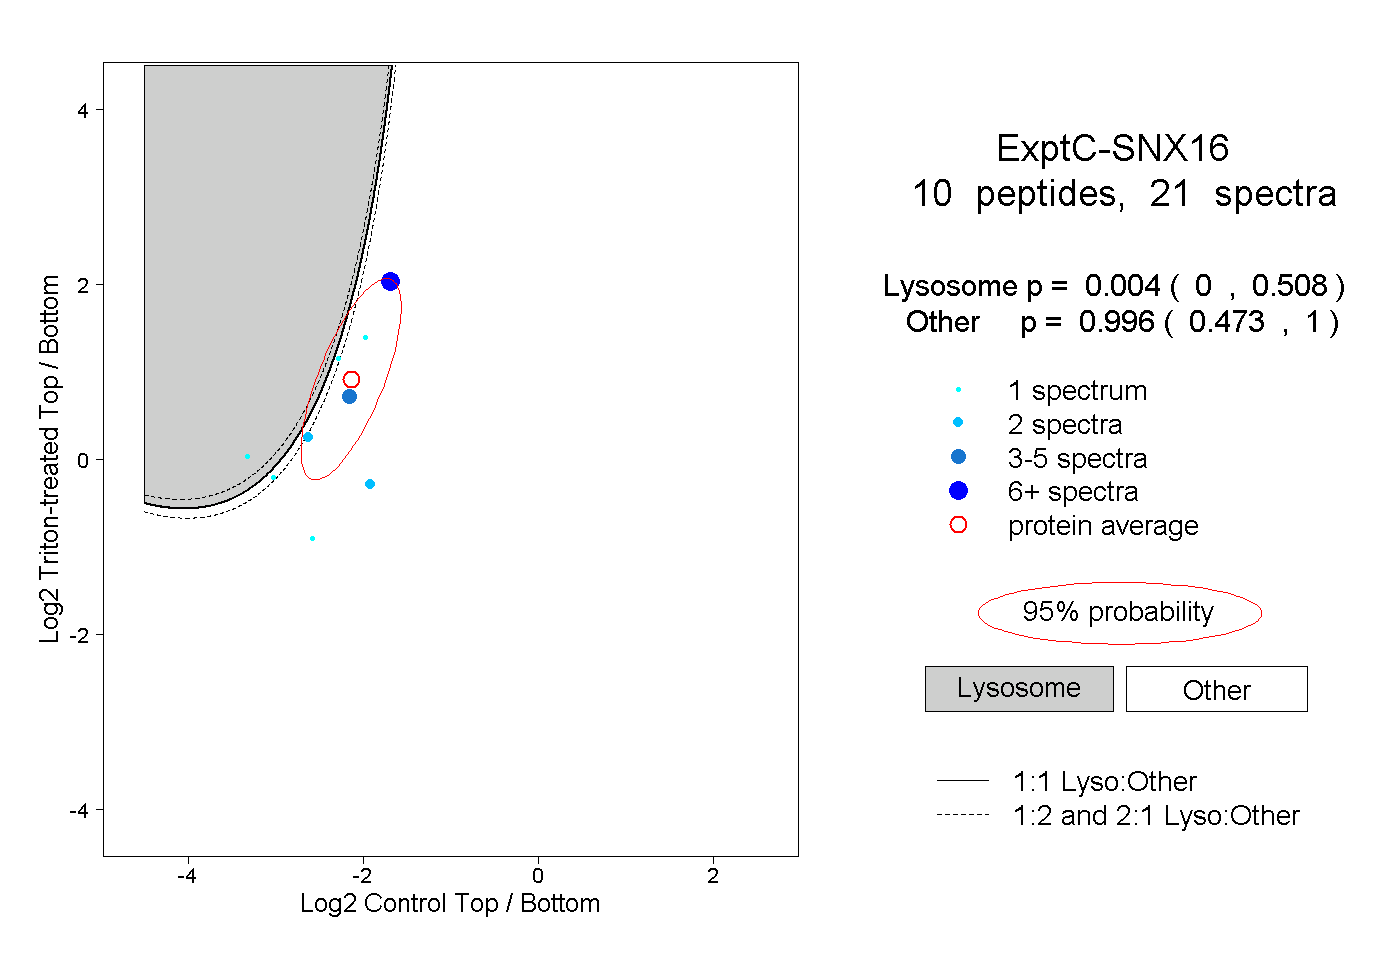
0.000 | 0.508
0.473 | 1.000
1peptide
spectrum
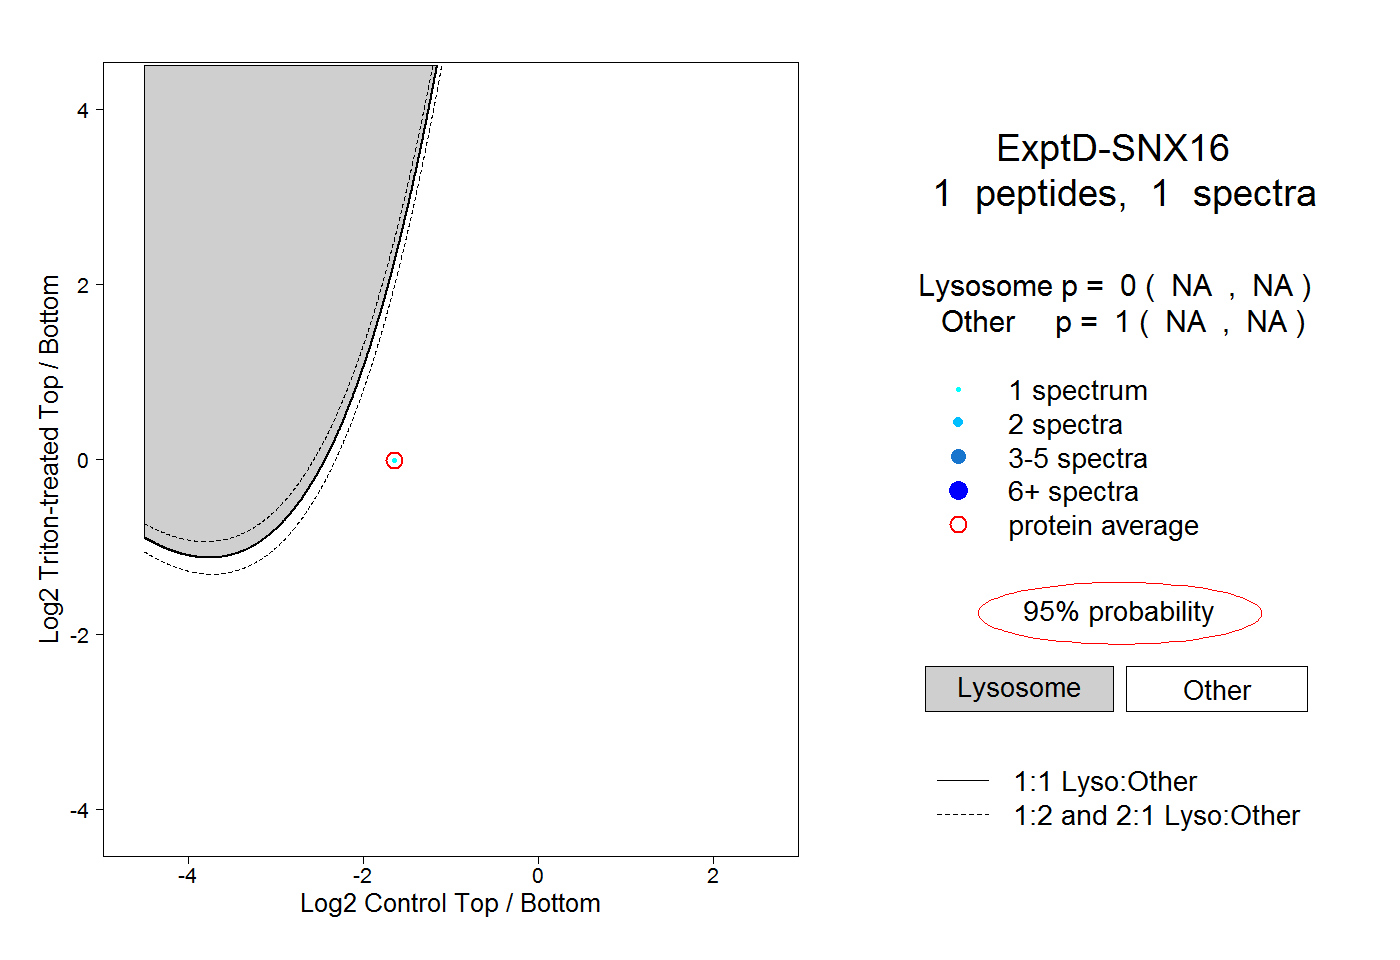
NA | NA
NA | NA