 6
6peptides
spectra
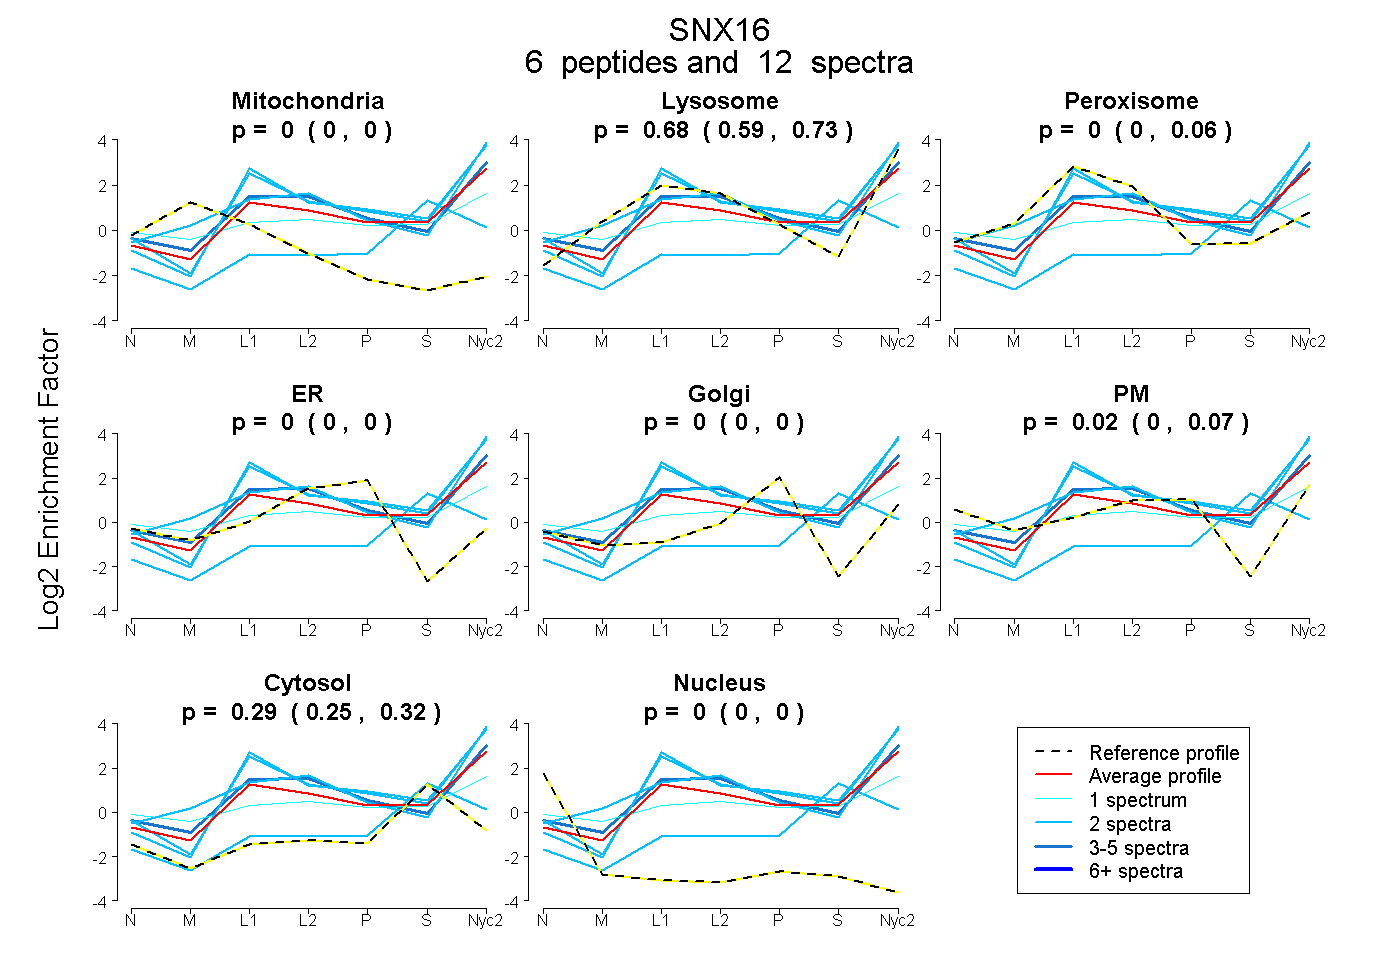
0.000 | 0.000
0.593 | 0.730
0.000 | 0.061
0.000 | 0.000
0.000 | 0.000
0.000 | 0.067
0.252 | 0.320
0.000 | 0.000
| Plot | Mito | Lyso | Perox | ER | Golgi | PM | Cytosol | Nucleus | |||||
| Expt A |
6 peptides |
12 spectra |
|
0.000 0.000 | 0.000 |
0.682 0.593 | 0.730 |
0.000 0.000 | 0.061 |
0.000 0.000 | 0.000 |
0.000 0.000 | 0.000 |
0.025 0.000 | 0.067 |
0.293 0.252 | 0.320 |
0.000 0.000 | 0.000 |
| 2 spectra, VQSSVLQVNR | 0.000 | 0.861 | 0.000 | 0.000 | 0.000 | 0.000 | 0.139 | 0.000 | ||
| 2 spectra, QLHIDALETR | 0.000 | 0.881 | 0.000 | 0.000 | 0.000 | 0.082 | 0.038 | 0.000 | ||
| 3 spectra, DNYNADFLEDR | 0.000 | 0.673 | 0.050 | 0.000 | 0.000 | 0.136 | 0.141 | 0.000 | ||
| 2 spectra, AFCETLEETNYHLQR | 0.000 | 0.109 | 0.000 | 0.000 | 0.000 | 0.000 | 0.891 | 0.000 | ||
| 2 spectra, DVLDEESR | 0.000 | 0.858 | 0.000 | 0.000 | 0.000 | 0.000 | 0.142 | 0.000 | ||
| 1 spectrum, FTGTDSSIEYSARPR | 0.000 | 0.295 | 0.098 | 0.000 | 0.000 | 0.282 | 0.325 | 0.000 |
| Plot | Lyso | Other | |||||||||||
| Expt C |
10 peptides |
21 spectra |
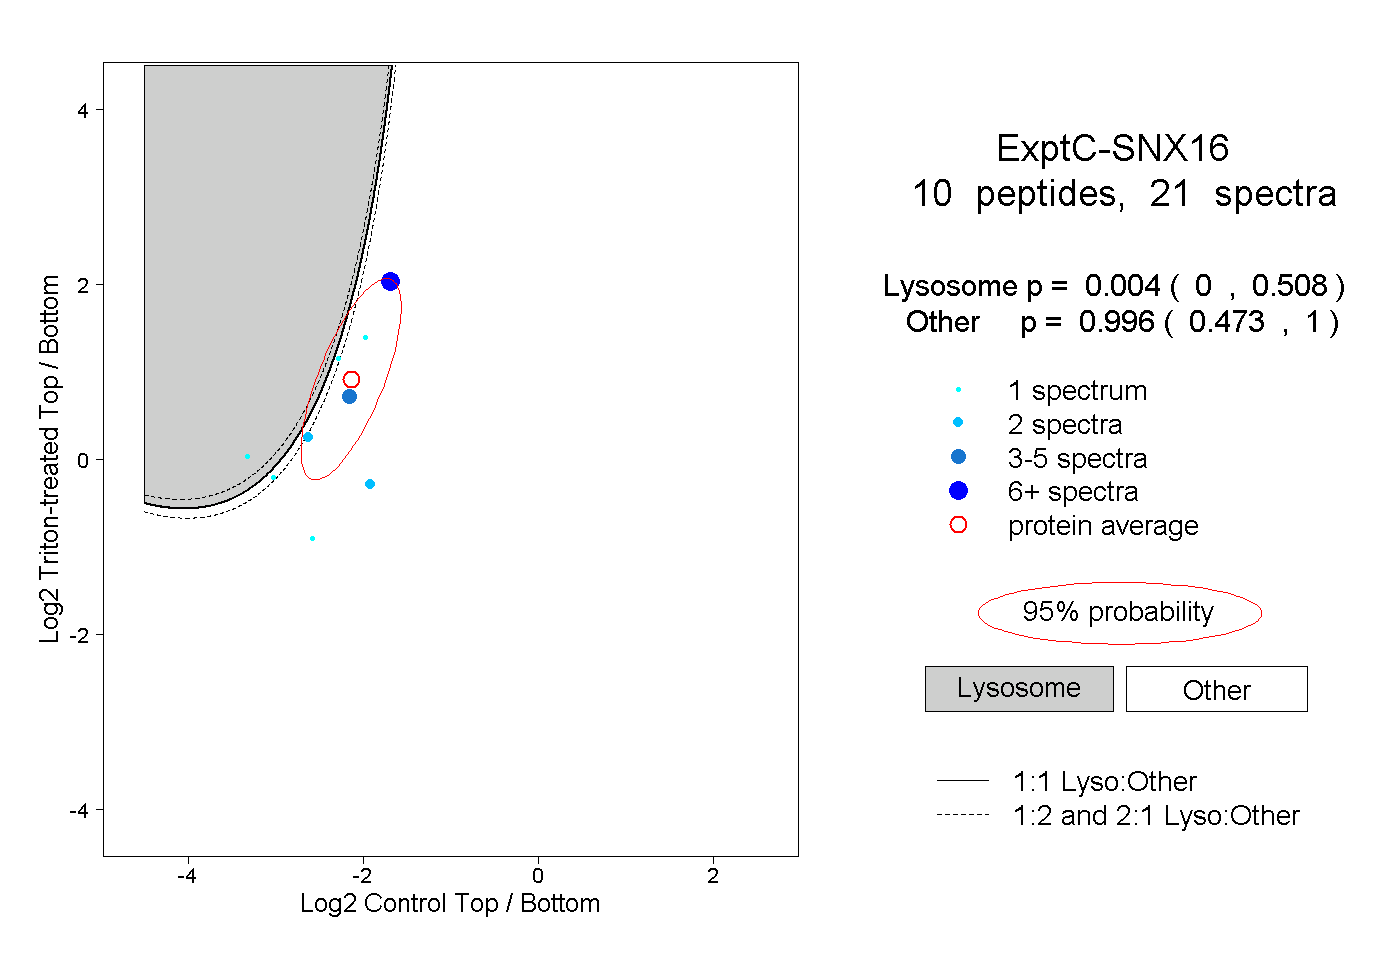 |
0.004 0.000 | 0.508 |
0.996 0.473 | 1.000 |
||||||||
| Plot | Lyso | Other | |||||||||||
| Expt D |
1 peptide |
1 spectrum |
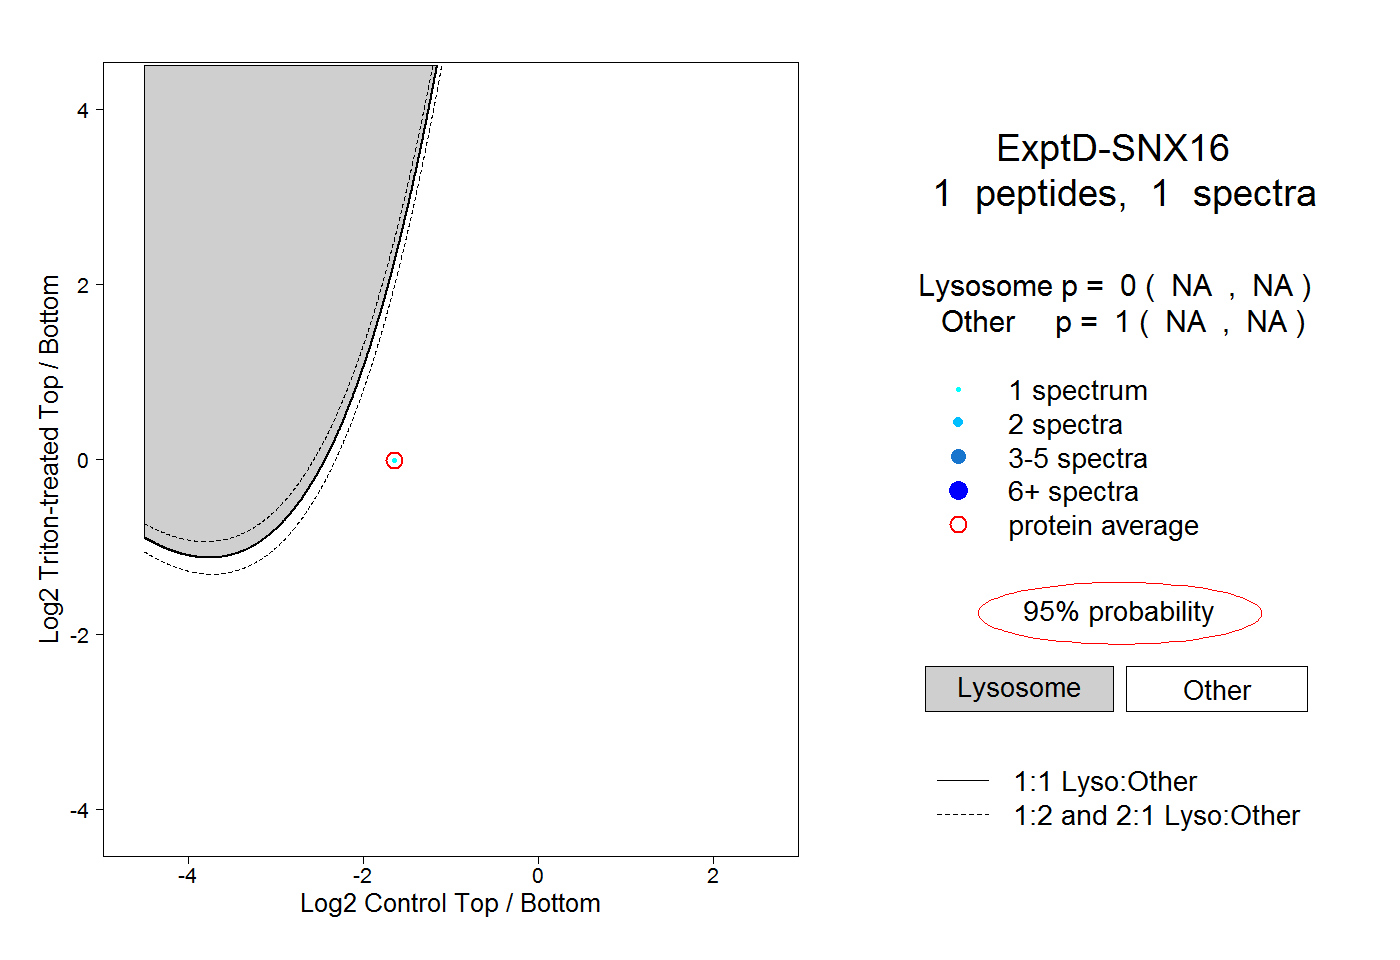 |
0.000 NA | NA |
1.000 NA | NA |