 9
9peptides
spectra
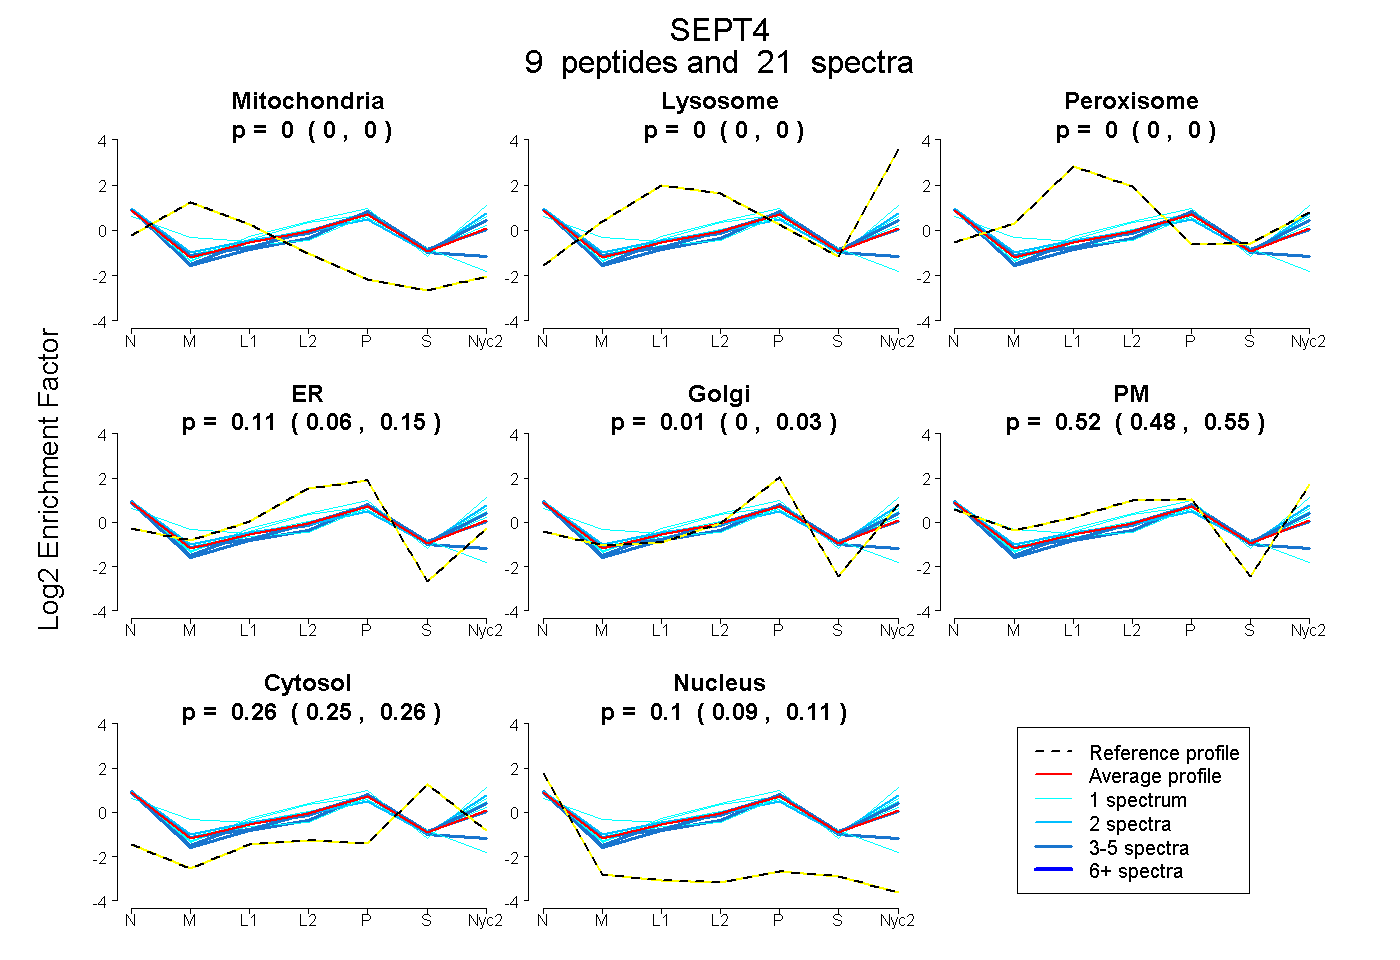
0.000 | 0.000
0.000 | 0.000
0.000 | 0.000
0.060 | 0.150
0.000 | 0.032
0.483 | 0.554
0.252 | 0.260
0.091 | 0.107
7peptides
spectra
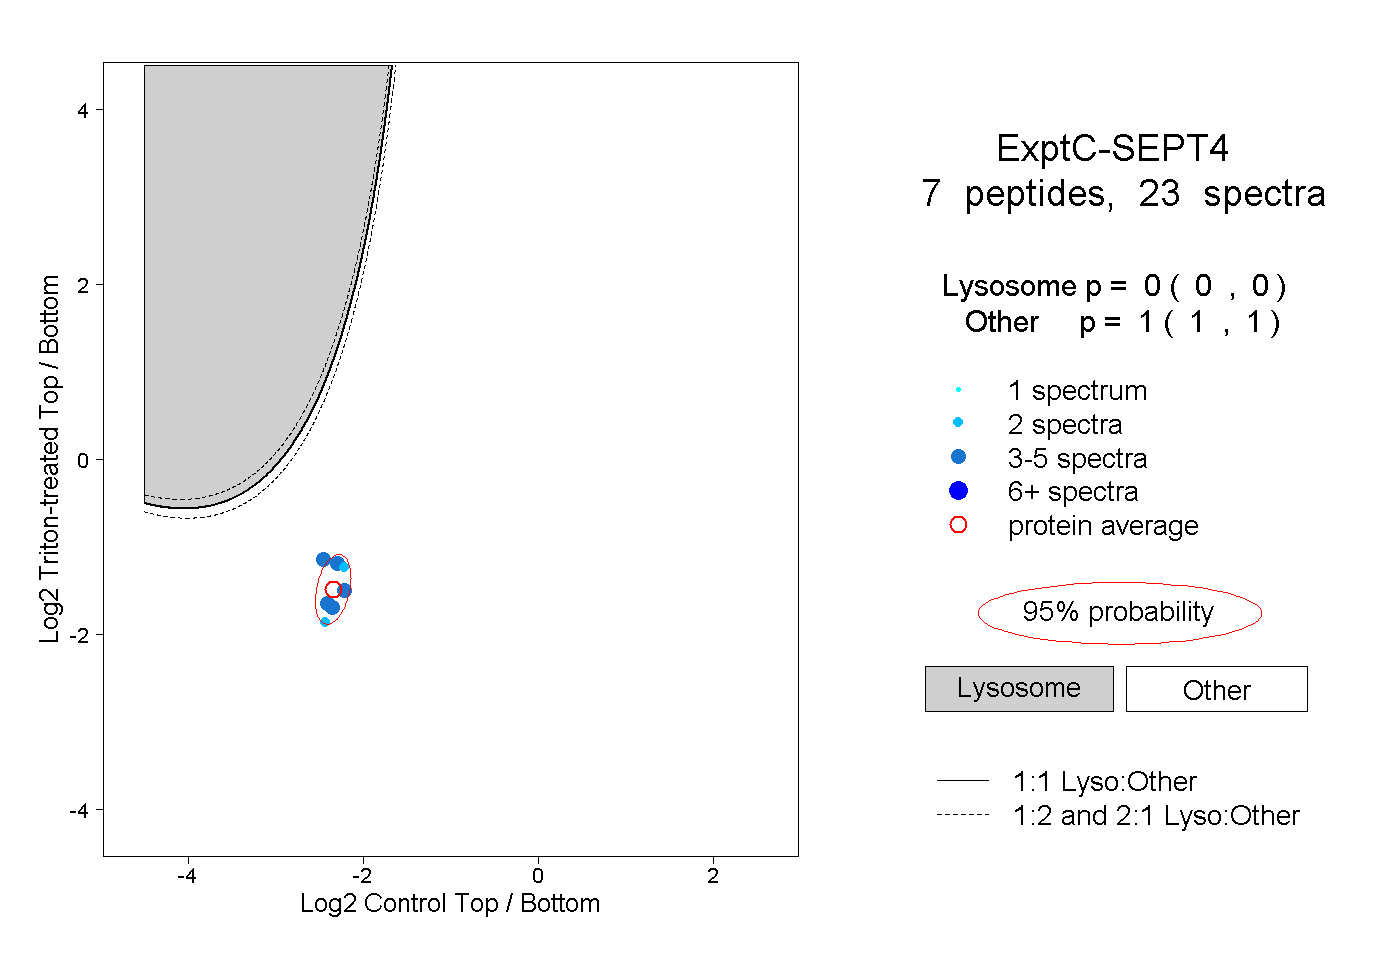
0.000 | 0.000
1.000 | 1.000
3peptides
spectra
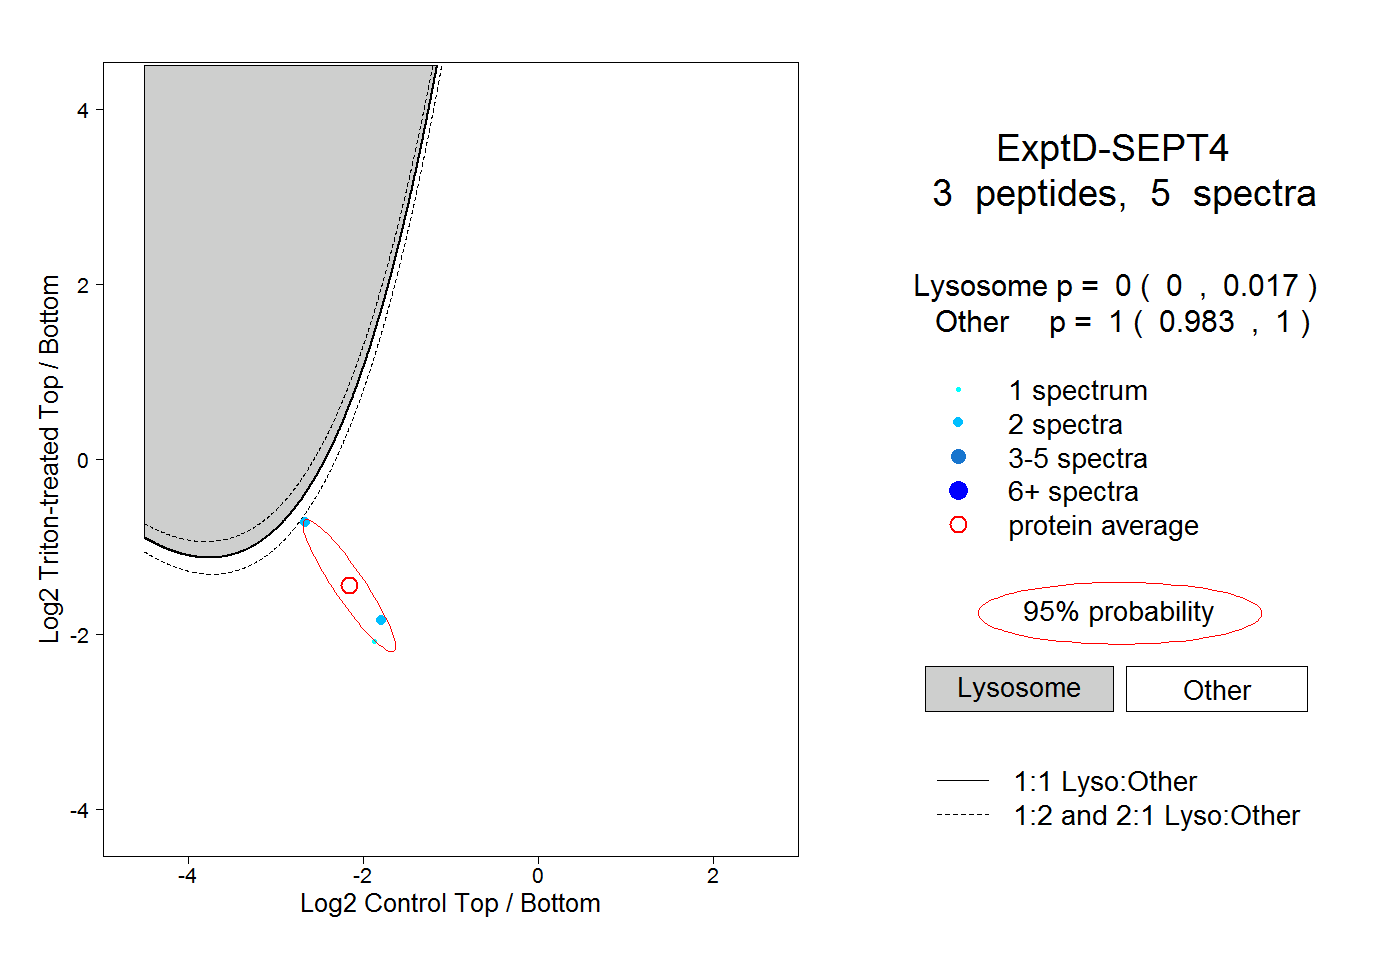
0.000 | 0.017
0.983 | 1.000