 9
9peptides
spectra
0.000 | 0.000
0.000 | 0.000
0.000 | 0.000
0.060 | 0.150
0.000 | 0.032
0.483 | 0.554
0.252 | 0.260
0.091 | 0.107
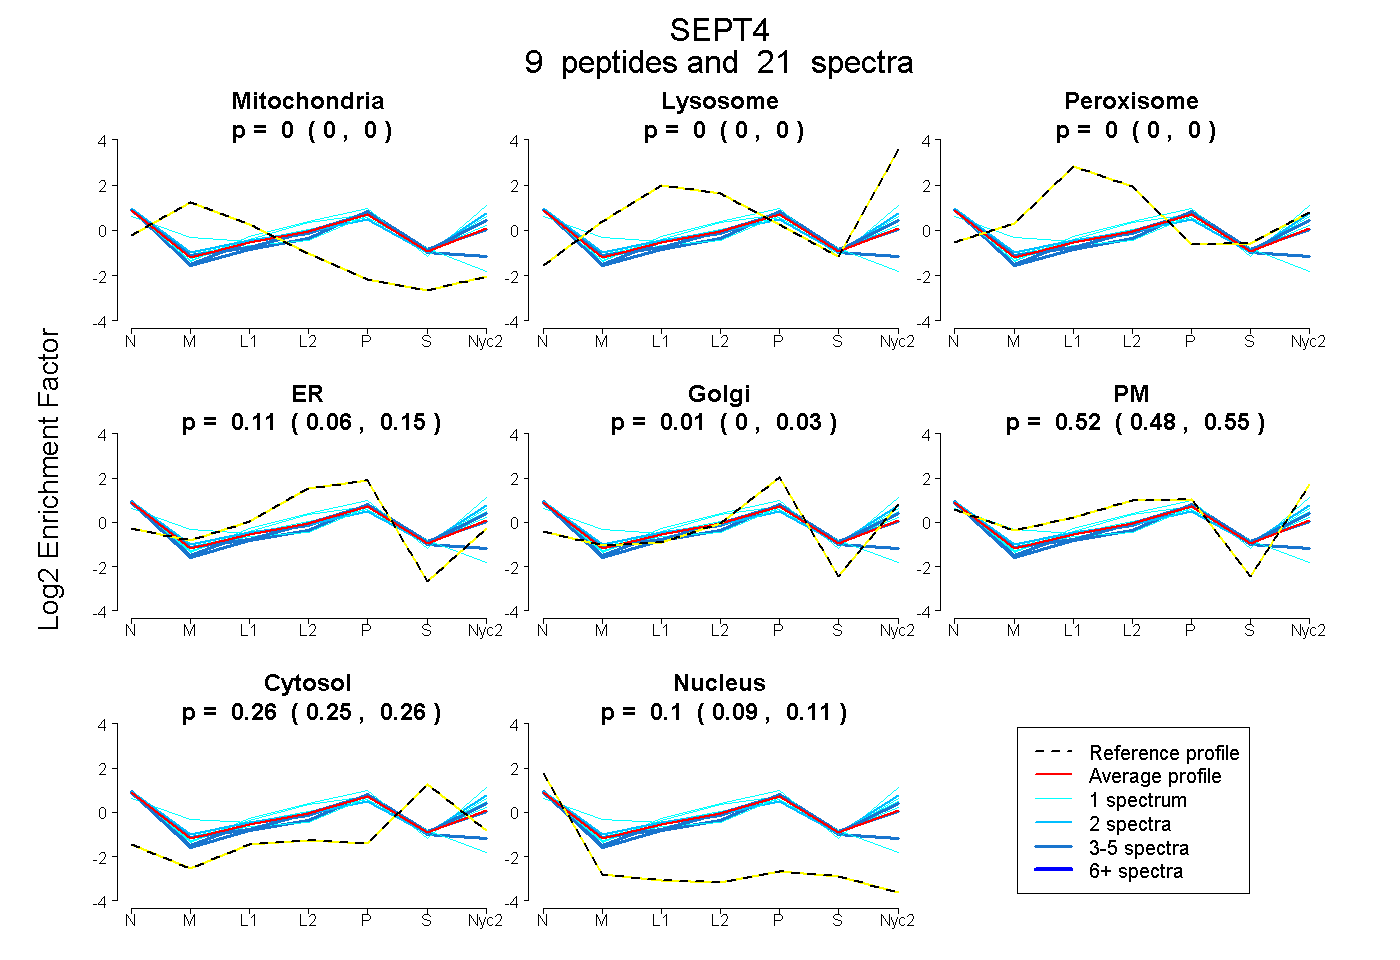
| Plot | Mito | Lyso | Perox | ER | Golgi | PM | Cytosol | Nucleus | |||||
| Expt A |
9 peptides |
21 spectra |
|
0.000 0.000 | 0.000 |
0.000 0.000 | 0.000 |
0.000 0.000 | 0.000 |
0.113 0.060 | 0.150 |
0.008 0.000 | 0.032 |
0.523 0.483 | 0.554 |
0.256 0.252 | 0.260 |
0.100 0.091 | 0.107 |
| 1 spectrum, ETHYENYR | 0.095 | 0.000 | 0.000 | 0.039 | 0.021 | 0.566 | 0.263 | 0.016 | ||
| 1 spectrum, LYPWGIVEVENPGHCDFVK | 0.000 | 0.000 | 0.064 | 0.466 | 0.000 | 0.000 | 0.219 | 0.251 | ||
| 1 spectrum, DESGLNR | 0.000 | 0.000 | 0.000 | 0.000 | 0.043 | 0.725 | 0.220 | 0.011 | ||
| 5 spectra, NIQDNR | 0.000 | 0.000 | 0.000 | 0.000 | 0.101 | 0.565 | 0.256 | 0.078 | ||
| 5 spectra, AQCIQSMTR | 0.000 | 0.000 | 0.047 | 0.470 | 0.000 | 0.075 | 0.213 | 0.195 | ||
| 2 spectra, HAVDIEEK | 0.000 | 0.000 | 0.000 | 0.000 | 0.000 | 0.681 | 0.253 | 0.066 | ||
| 1 spectrum, IMQTVEITK | 0.000 | 0.000 | 0.000 | 0.000 | 0.048 | 0.621 | 0.266 | 0.064 | ||
| 1 spectrum, EEIEHFGIK | 0.000 | 0.000 | 0.000 | 0.022 | 0.000 | 0.677 | 0.252 | 0.048 | ||
| 4 spectra, ADTLTPSEVDR | 0.000 | 0.000 | 0.000 | 0.000 | 0.226 | 0.395 | 0.260 | 0.119 |
| Plot | Lyso | Other | |||||||||||
| Expt C |
7 peptides |
23 spectra |
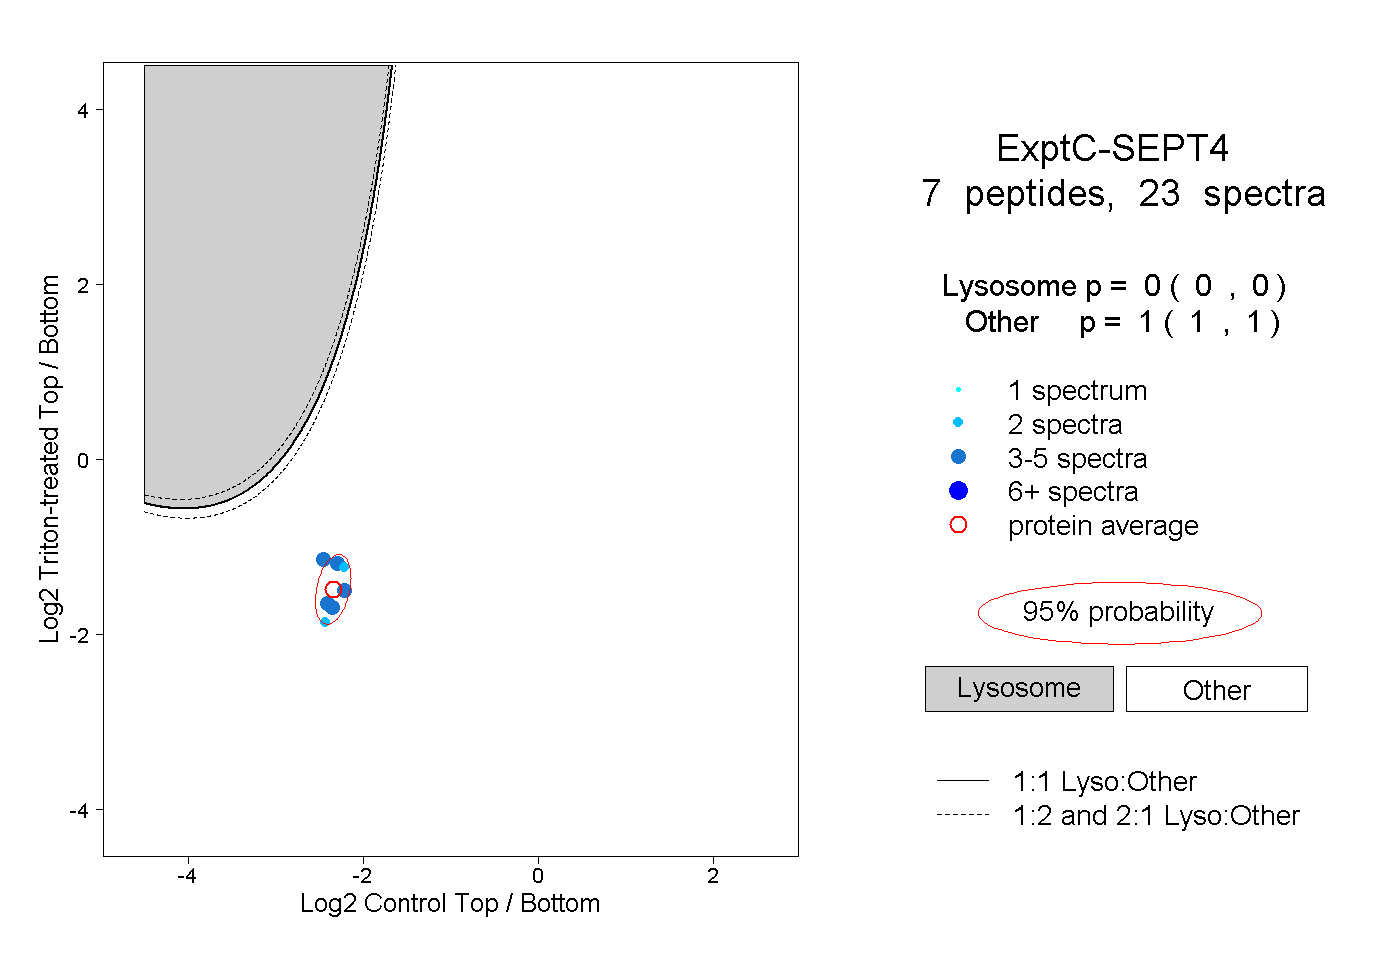 |
0.000 0.000 | 0.000 |
1.000 1.000 | 1.000 |
||||||||
| Plot | Lyso | Other | |||||||||||
| Expt D |
3 peptides |
5 spectra |
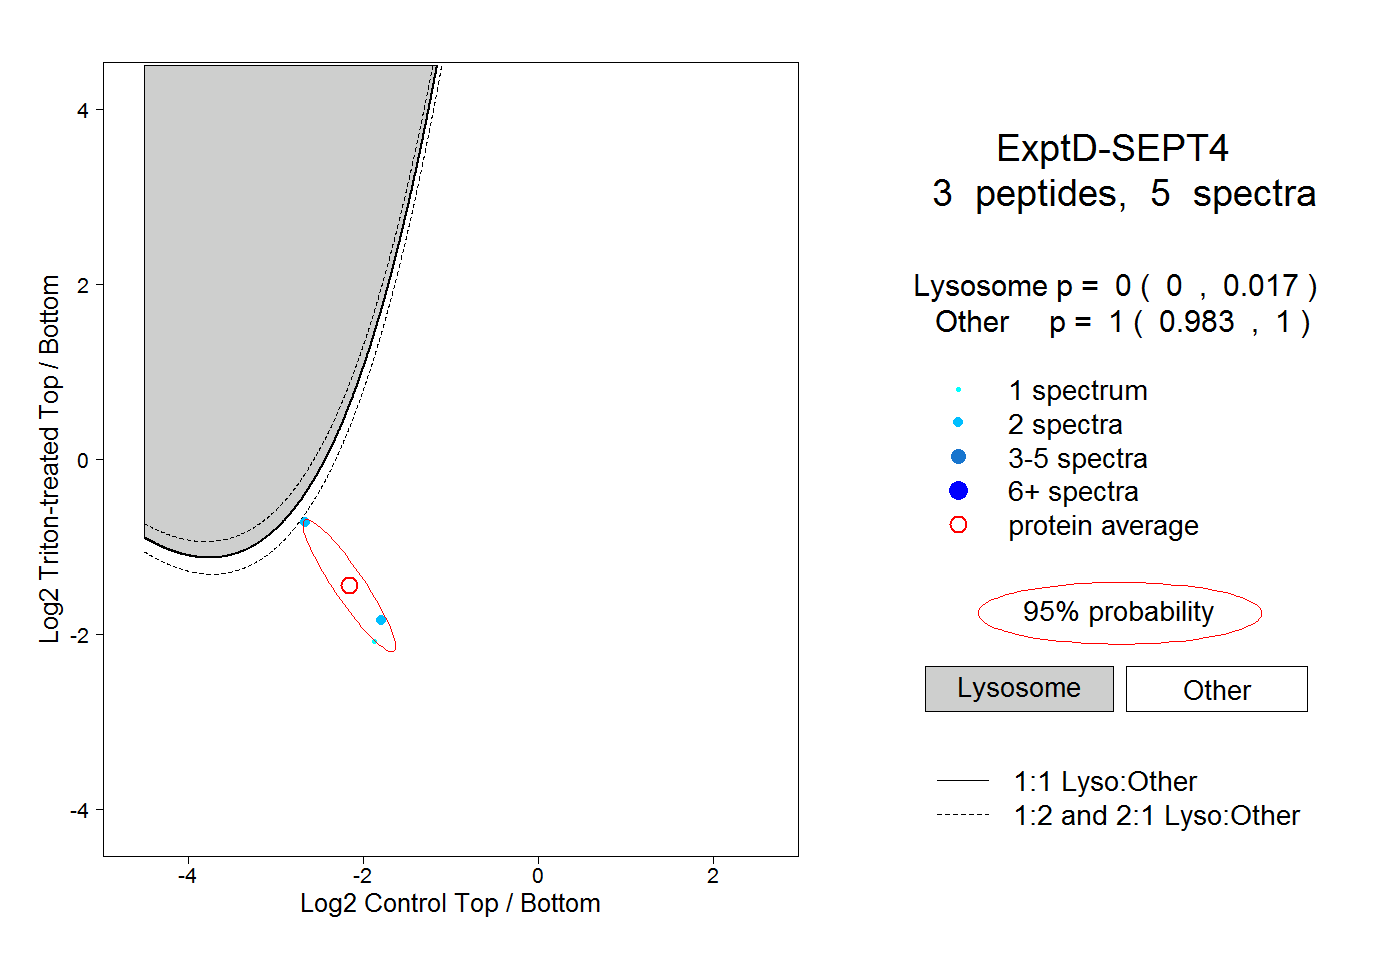 |
0.000 0.000 | 0.017 |
1.000 0.983 | 1.000 |