 4
4peptides
spectra
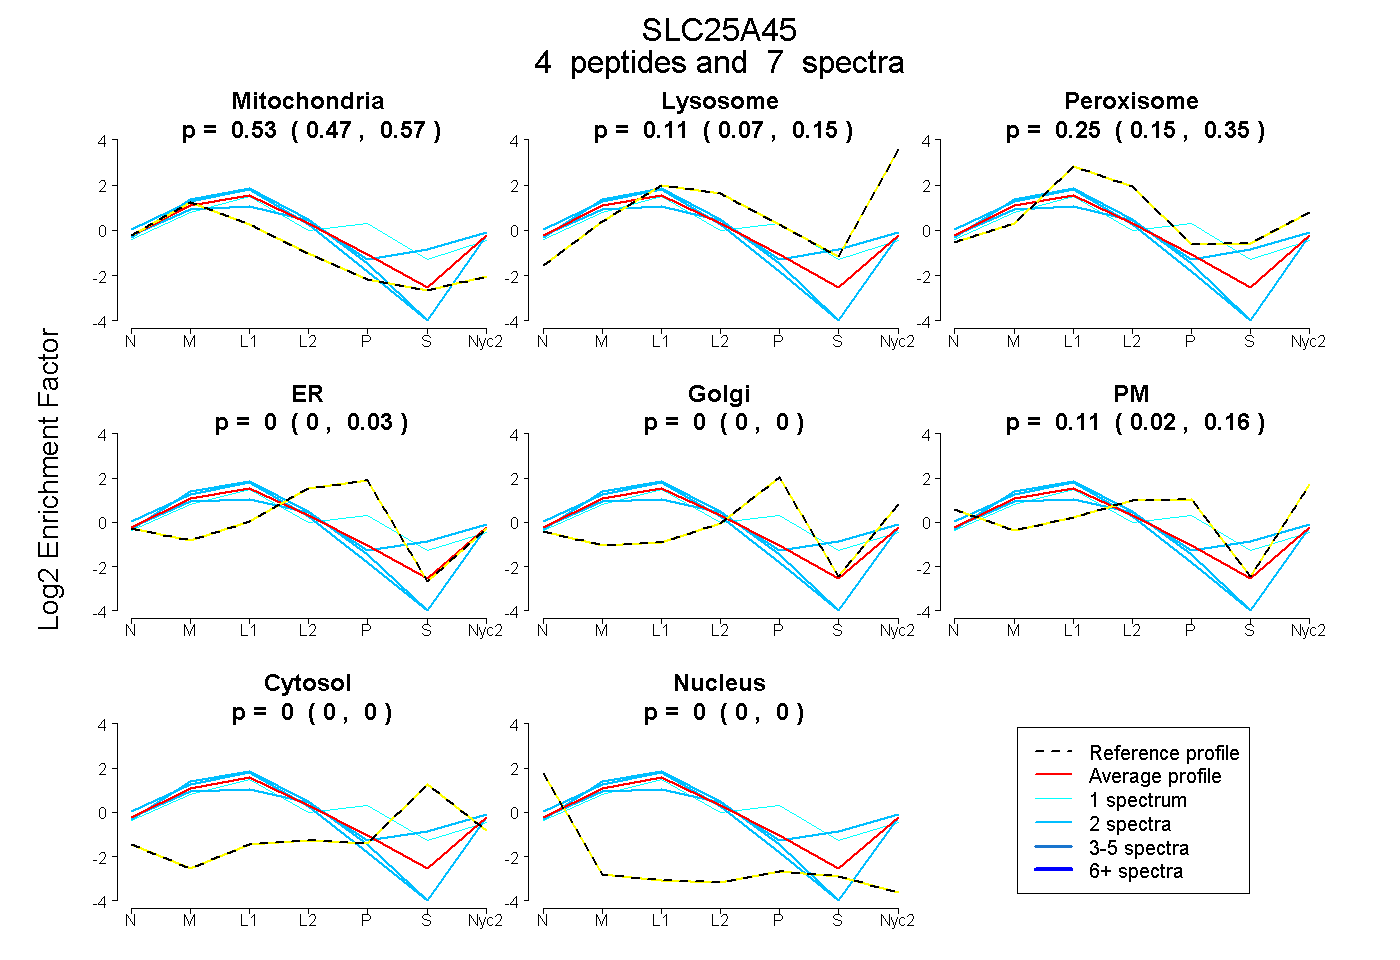
0.471 | 0.571
0.067 | 0.152
0.146 | 0.354
0.000 | 0.033
0.000 | 0.000
0.023 | 0.161
0.000 | 0.000
0.000 | 0.000
6peptides
spectra
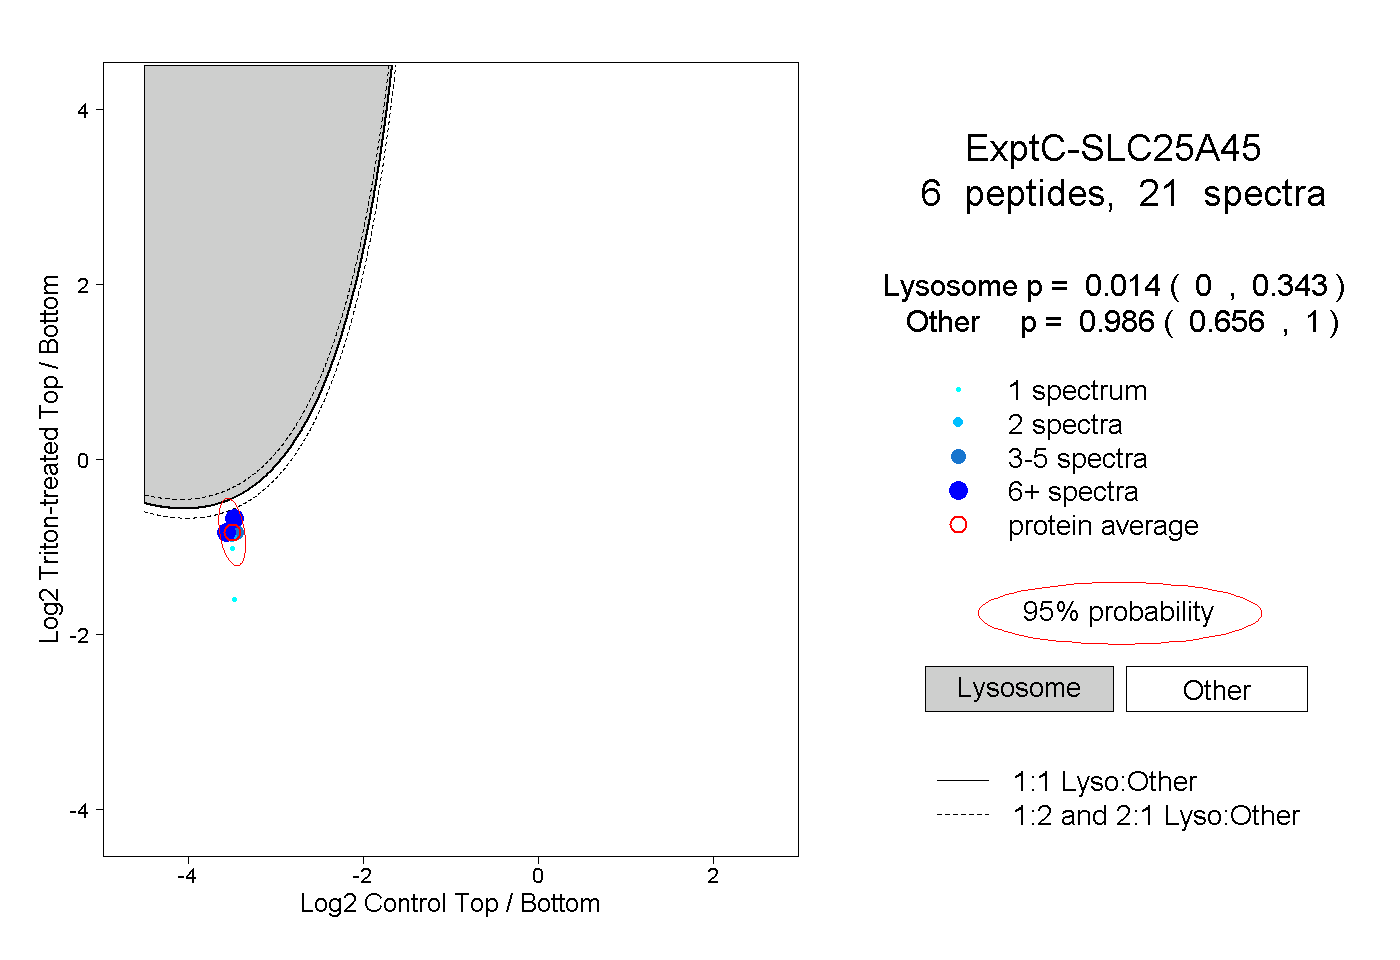
0.000 | 0.343
0.656 | 1.000
2peptides
spectra
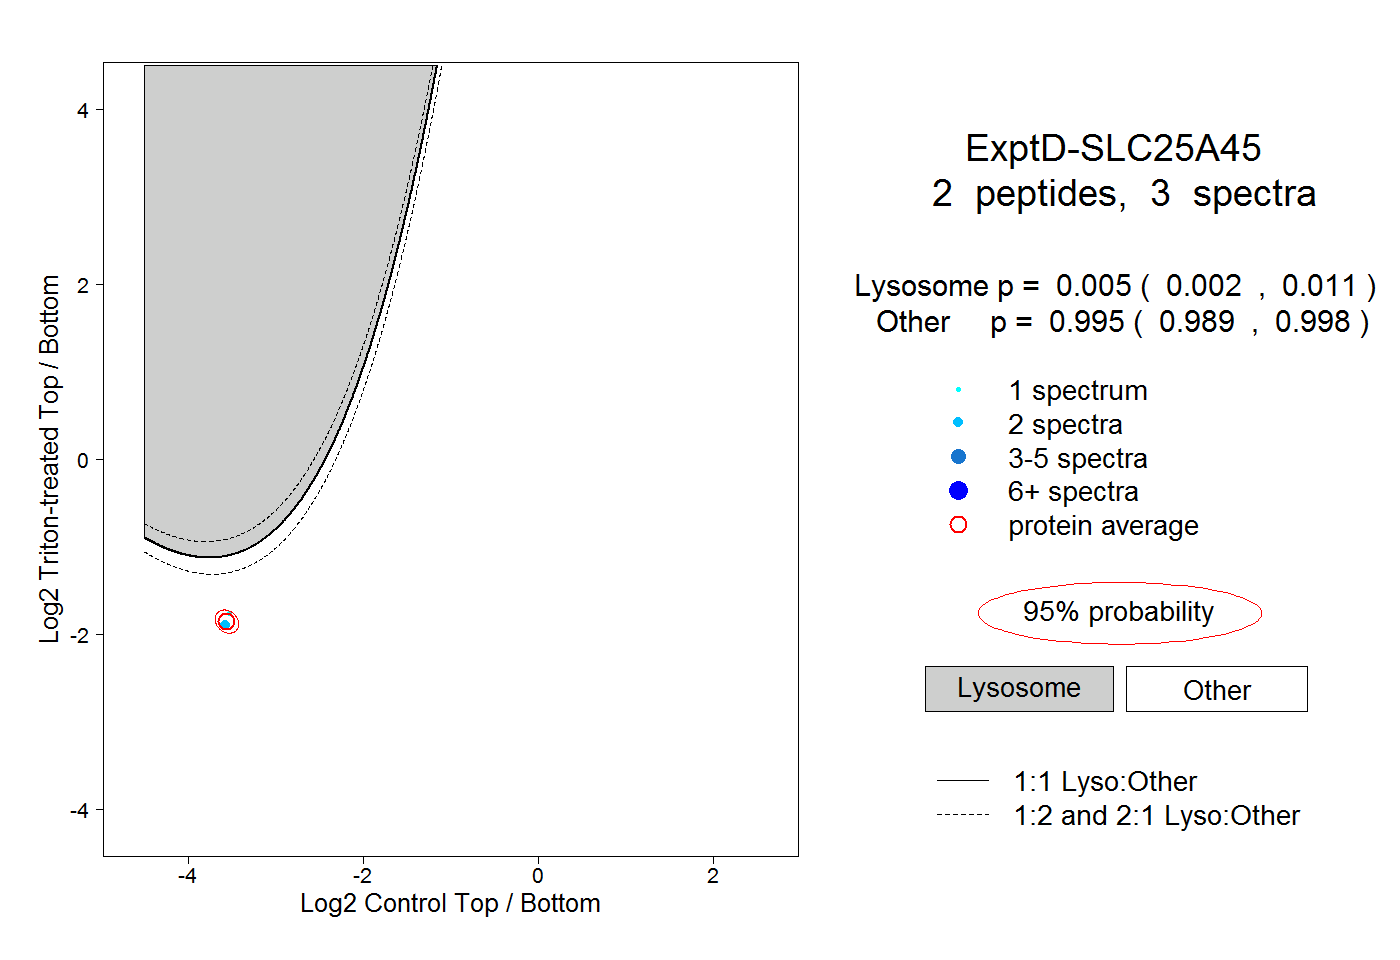
0.002 | 0.011
0.989 | 0.998