 4
4peptides
spectra
0.471 | 0.571
0.067 | 0.152
0.146 | 0.354
0.000 | 0.033
0.000 | 0.000
0.023 | 0.161
0.000 | 0.000
0.000 | 0.000
6peptides
spectra
0.000 | 0.343
0.656 | 1.000
| Plot | Mito | Lyso | Perox | ER | Golgi | PM | Cytosol | Nucleus | |||||
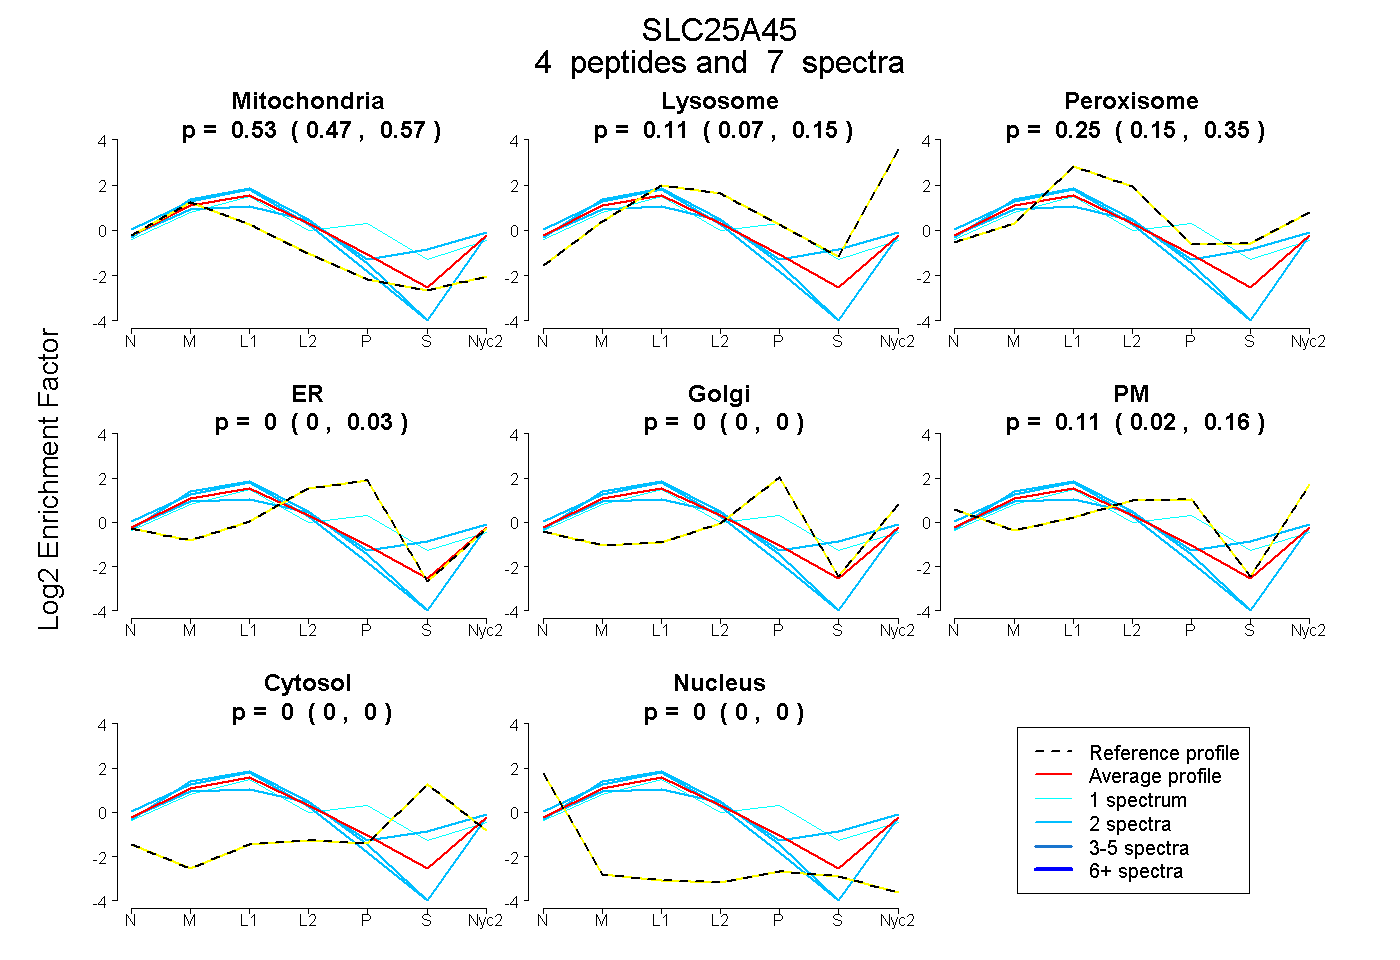
| Expt A |
4 peptides |
7 spectra |
|
0.527 0.471 | 0.571 |
0.112 0.067 | 0.152 |
0.254 0.146 | 0.354 |
0.000 0.000 | 0.033 |
0.000 0.000 | 0.000 |
0.107 0.023 | 0.161 |
0.000 0.000 | 0.000 |
0.000 0.000 | 0.000 |
||
| Plot | Lyso | Other | |||||||||||
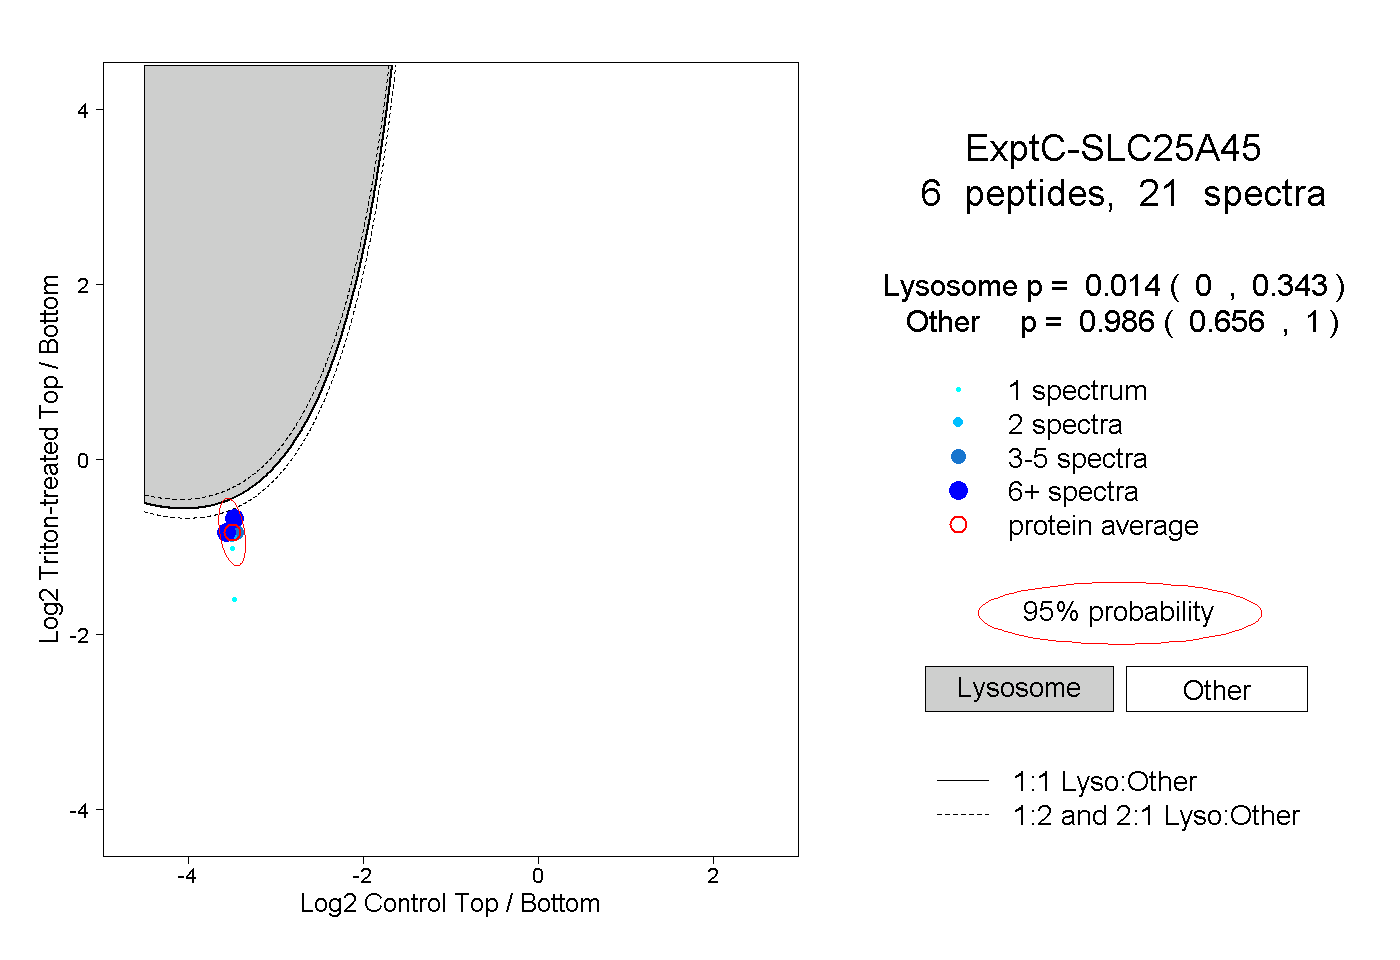
| Expt C |
6 peptides |
21 spectra |
|
0.014 0.000 | 0.343 |
0.986 0.656 | 1.000 |
| 6 spectra, LQNQTEPR | 0.016 | 0.984 | ||||||||
| 2 spectra, GSWALVLR | 0.007 | 0.993 | ||||||||
| 1 spectrum, GMTLNSAR | 0.000 | 1.000 | ||||||||
| 1 spectrum, QEGIGVFFK | 0.002 | 0.998 | ||||||||
| 7 spectra, MQIGSSTPR | 0.071 | 0.929 | ||||||||
| 4 spectra, EEGPQGLFR | 0.011 | 0.989 |
| Plot | Lyso | Other | |||||||||||
| Expt D |
2 peptides |
3 spectra |
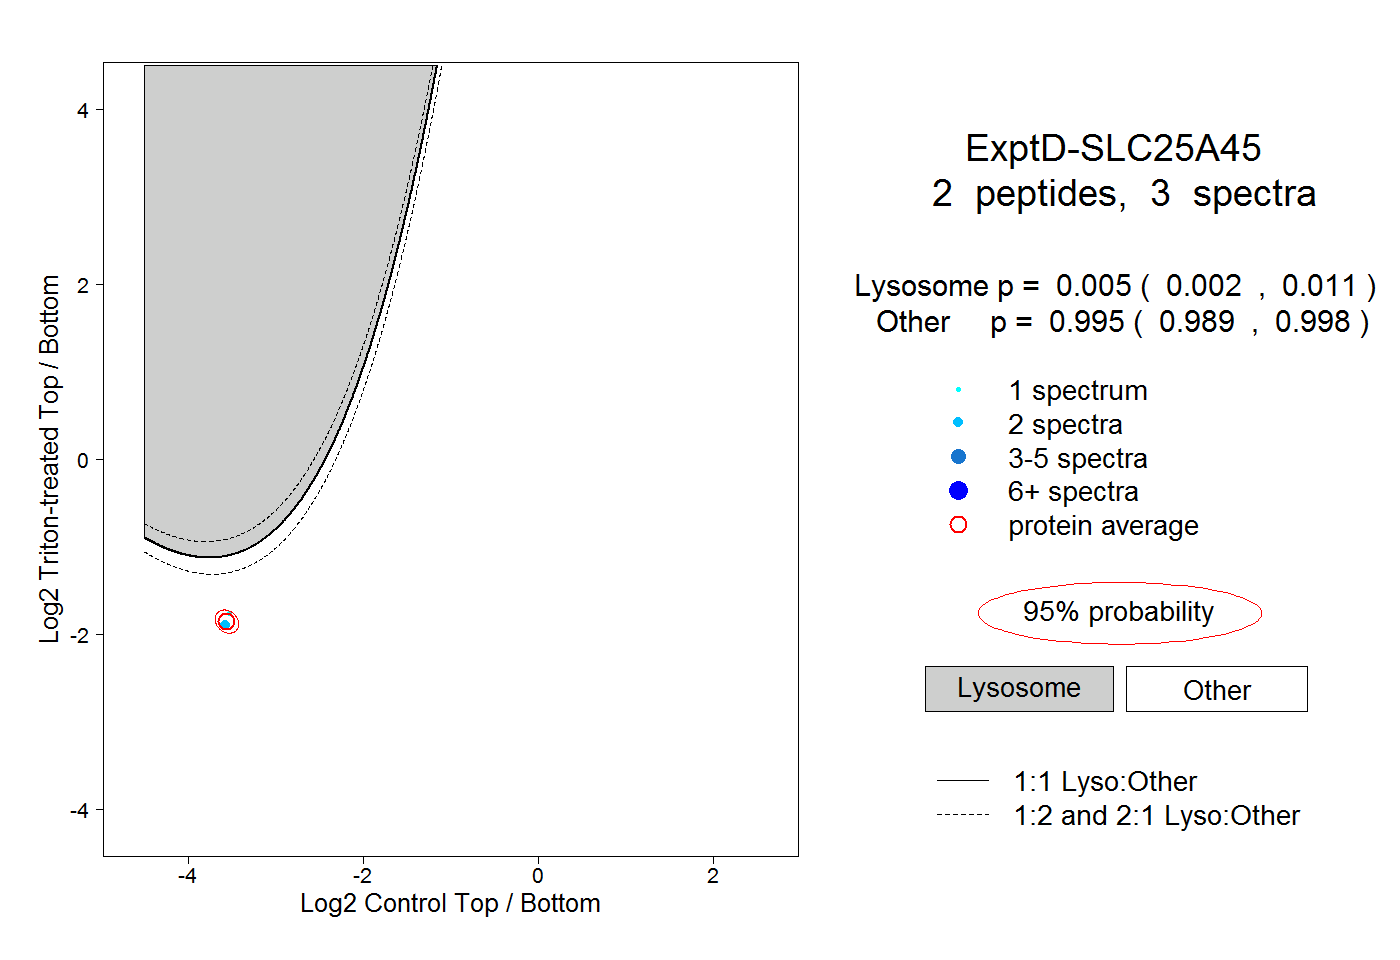 |
0.005 0.002 | 0.011 |
0.995 0.989 | 0.998 |