 18
18peptides
spectra
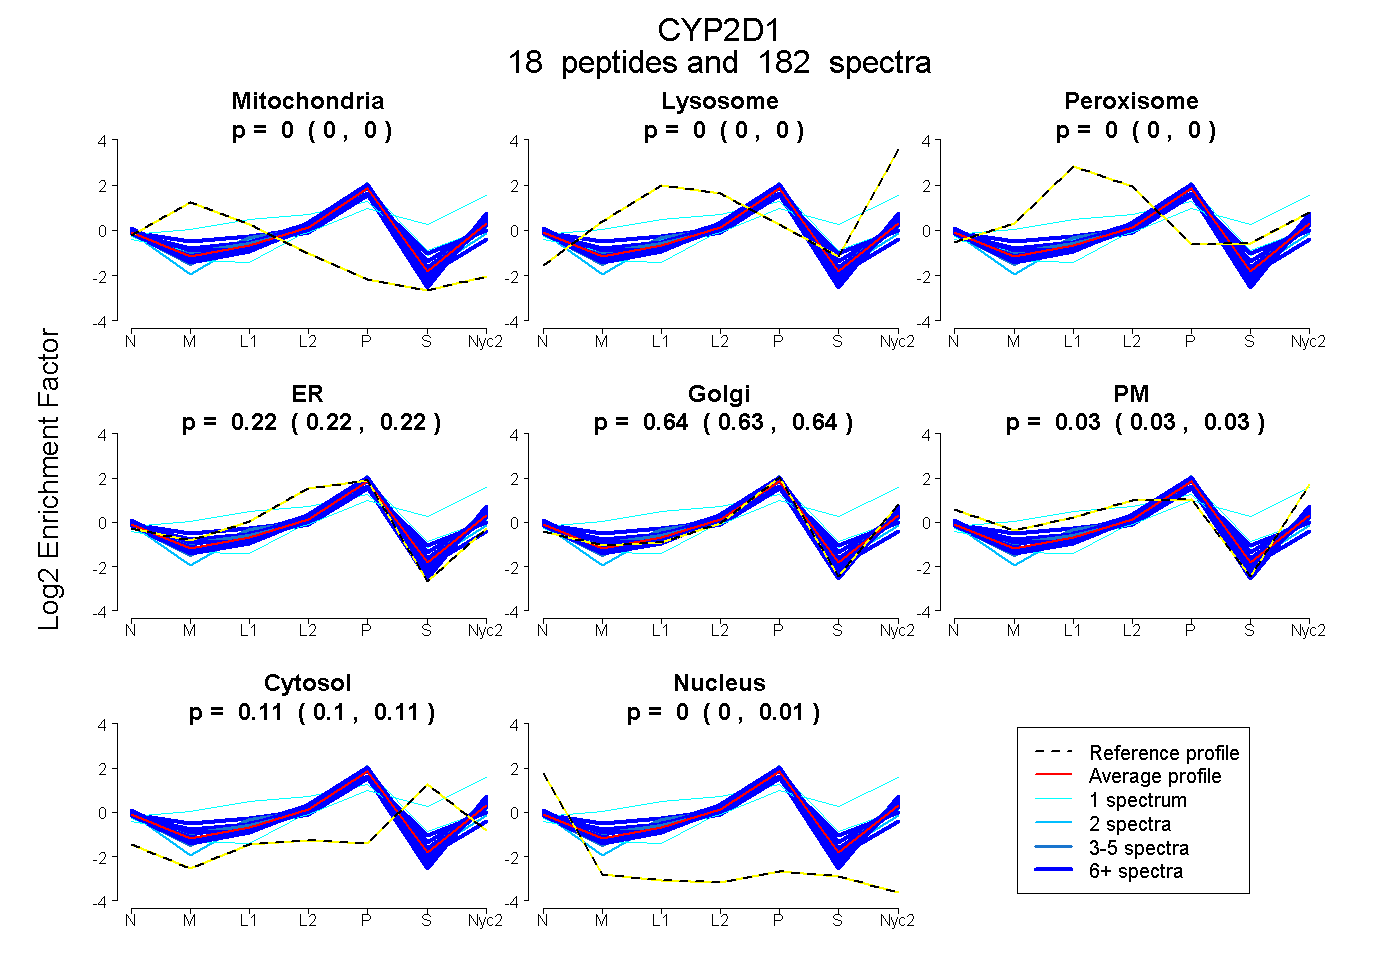
0.000 | 0.000
0.000 | 0.000
0.000 | 0.000
0.216 | 0.224
0.634 | 0.643
0.026 | 0.033
0.103 | 0.108
0.003 | 0.006
19peptides
spectra
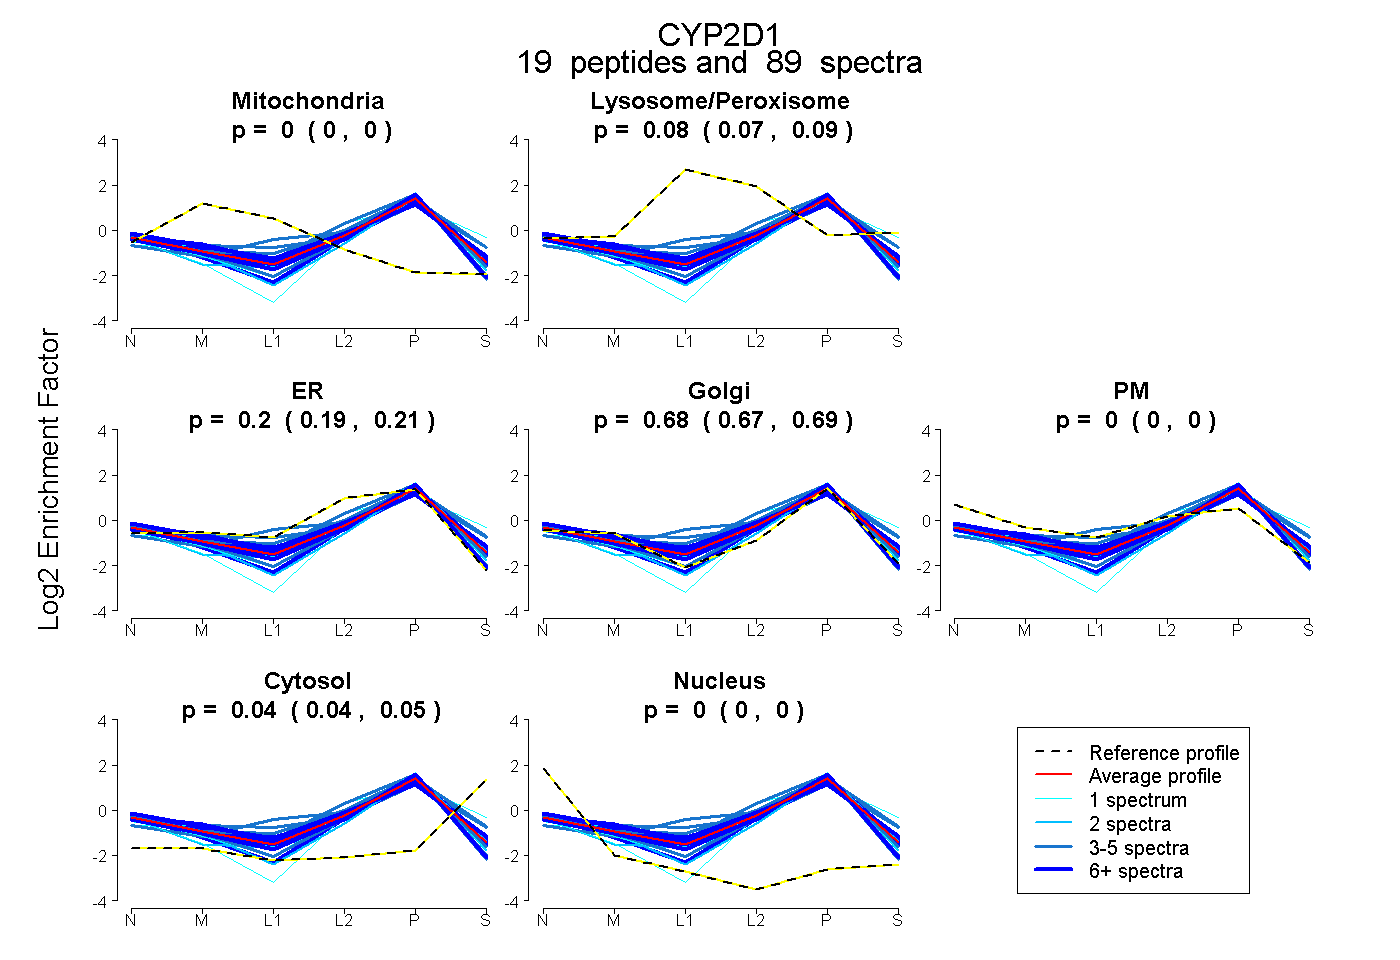
0.000 | 0.000
0.074 | 0.086
0.186 | 0.209
0.668 | 0.686
0.000 | 0.000
0.040 | 0.047
0.000 | 0.000
16peptides
spectra
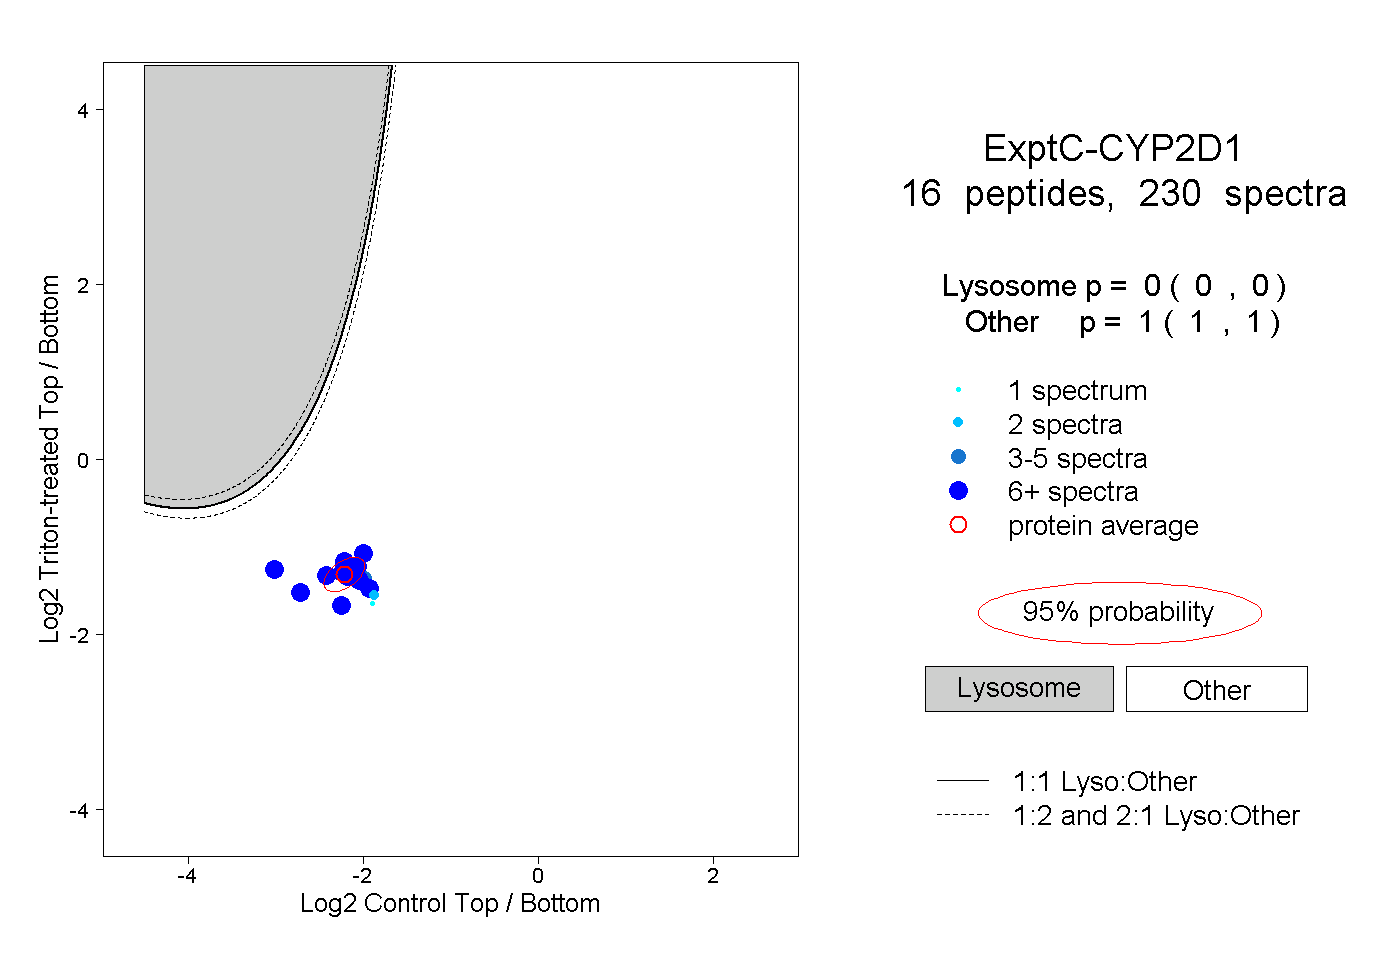
0.000 | 0.000
1.000 | 1.000
9peptides
spectra
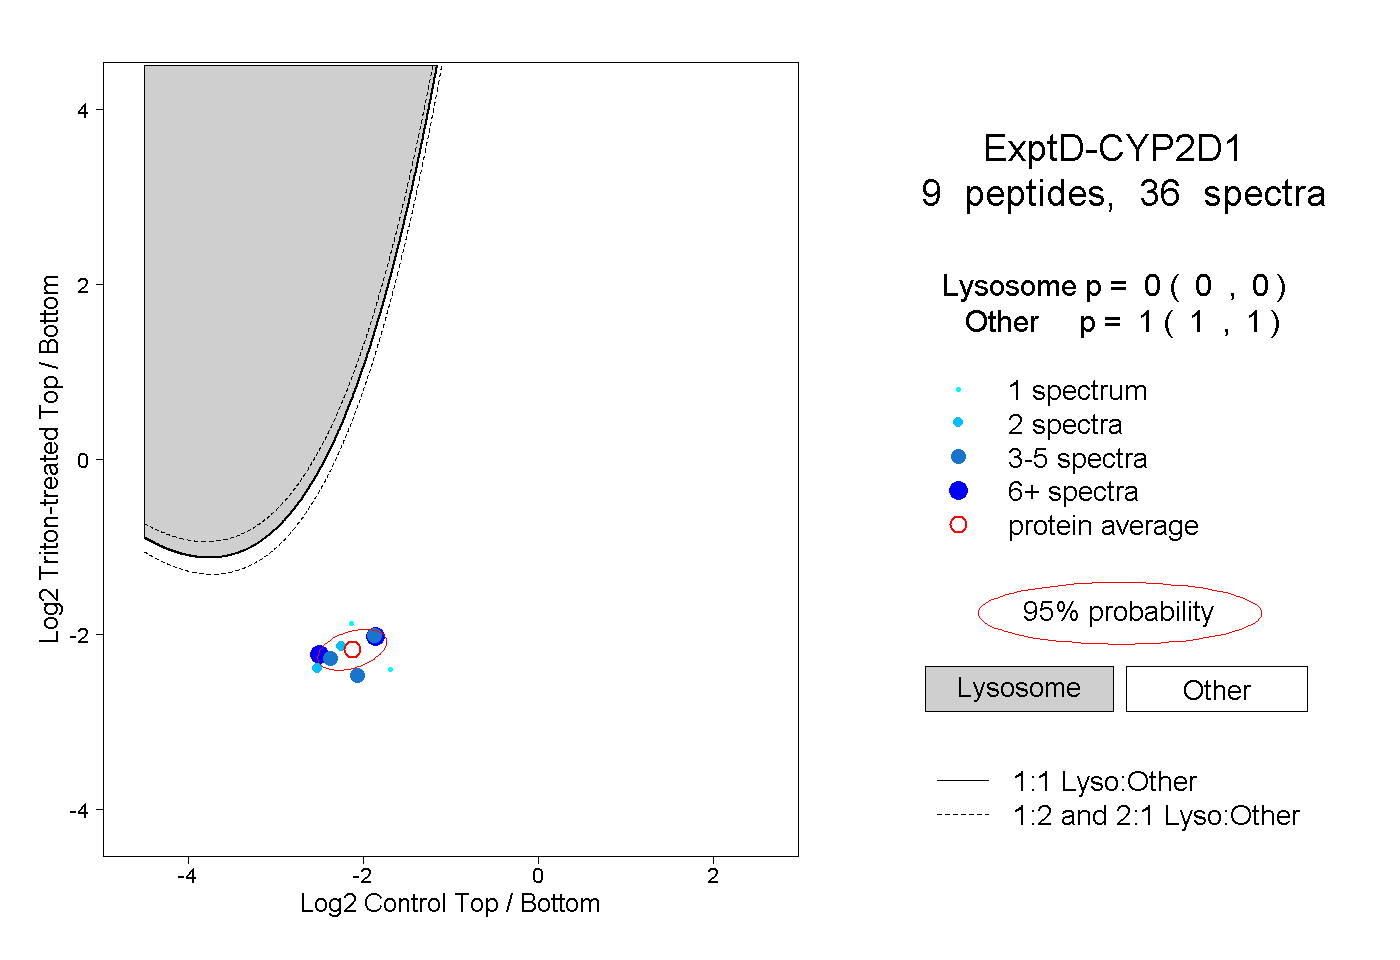
0.000 | 0.000
1.000 | 1.000