 18
18peptides
spectra
0.000 | 0.000
0.000 | 0.000
0.000 | 0.000
0.216 | 0.224
0.634 | 0.643
0.026 | 0.033
0.103 | 0.108
0.003 | 0.006
| Plot | Mito | Lyso | Perox | ER | Golgi | PM | Cytosol | Nucleus | |||||
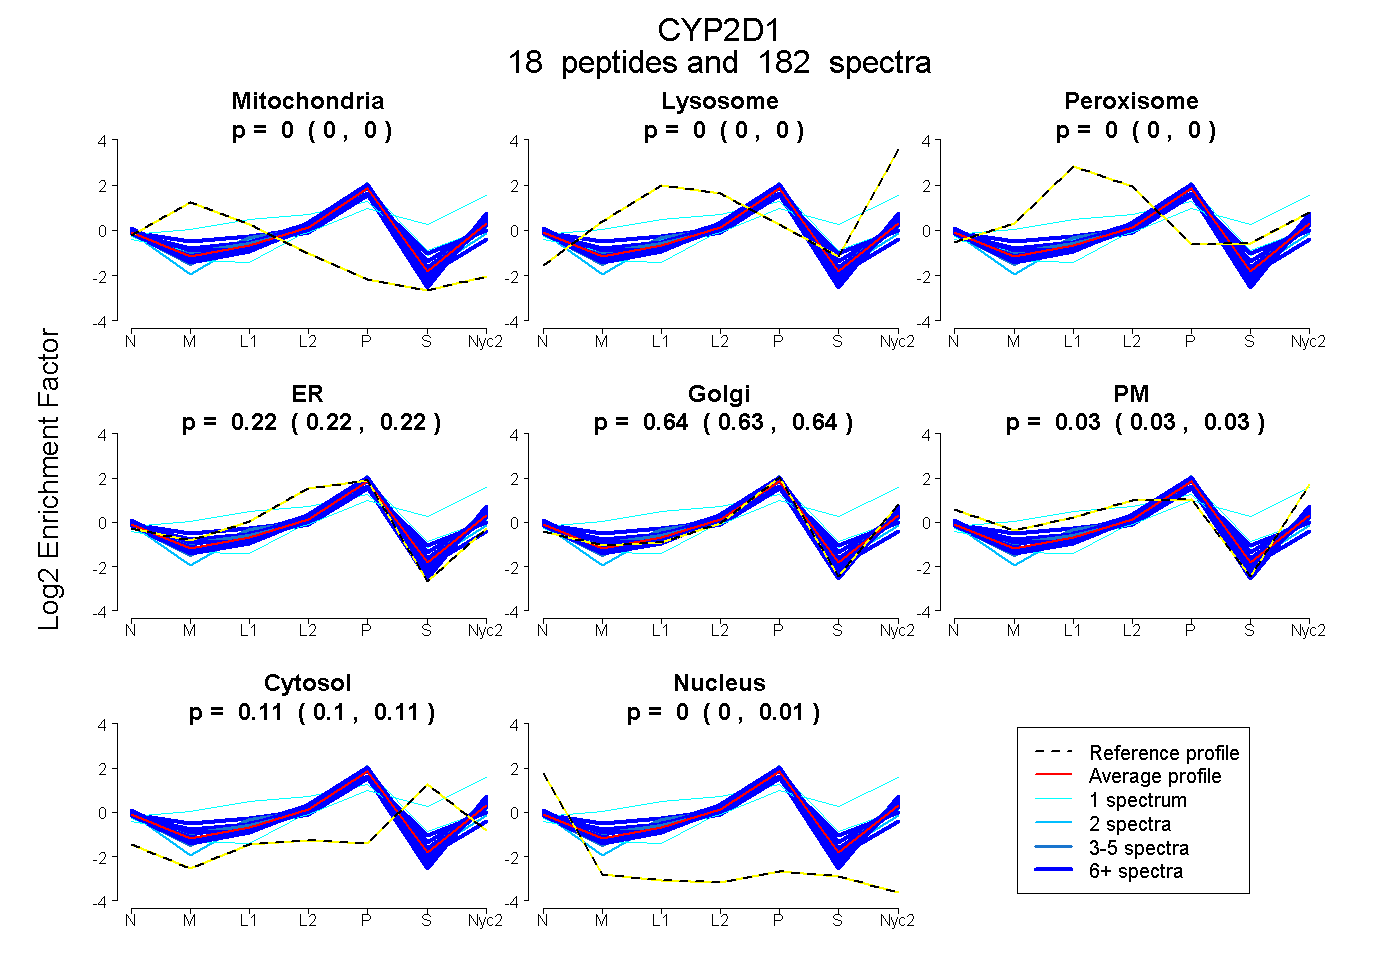
| Expt A |
18 peptides |
182 spectra |
|
0.000 0.000 | 0.000 |
0.000 0.000 | 0.000 |
0.000 0.000 | 0.000 |
0.220 0.216 | 0.224 |
0.639 0.634 | 0.643 |
0.030 0.026 | 0.033 |
0.106 0.103 | 0.108 |
0.004 0.003 | 0.006 |
| 14 spectra, VFQGQK | 0.000 | 0.000 | 0.000 | 0.195 | 0.714 | 0.064 | 0.000 | 0.027 | ||
| 1 spectrum, EAGHLCDAFTAQAGQSINPK | 0.045 | 0.000 | 0.327 | 0.221 | 0.357 | 0.000 | 0.051 | 0.000 | ||
| 32 spectra, CLGVKPR | 0.000 | 0.000 | 0.000 | 0.396 | 0.476 | 0.000 | 0.058 | 0.070 | ||
| 2 spectra, AVQEVLVTHGEDTADRPPVPIFK | 0.000 | 0.000 | 0.000 | 0.320 | 0.532 | 0.000 | 0.118 | 0.030 | ||
| 1 spectrum, TFMALLDNLLAENR | 0.000 | 0.256 | 0.000 | 0.000 | 0.336 | 0.050 | 0.357 | 0.000 | ||
| 11 spectra, FGDIAPLNLPR | 0.000 | 0.000 | 0.000 | 0.171 | 0.777 | 0.015 | 0.024 | 0.013 | ||
| 6 spectra, CPEMTDQAHMPYTNAVIHEVQR | 0.087 | 0.003 | 0.000 | 0.047 | 0.612 | 0.251 | 0.000 | 0.000 | ||
| 14 spectra, VQQEIDEVIGQVR | 0.000 | 0.000 | 0.000 | 0.149 | 0.774 | 0.000 | 0.054 | 0.022 | ||
| 1 spectrum, GTTLIINLSSVLK | 0.000 | 0.000 | 0.000 | 0.071 | 0.687 | 0.000 | 0.242 | 0.000 | ||
| 12 spectra, TTWDPAQPPR | 0.000 | 0.000 | 0.000 | 0.129 | 0.804 | 0.000 | 0.068 | 0.000 | ||
| 4 spectra, FEYEDPYLIR | 0.000 | 0.000 | 0.040 | 0.118 | 0.778 | 0.000 | 0.064 | 0.000 | ||
| 15 spectra, NLTDAFLAEVEK | 0.000 | 0.000 | 0.075 | 0.182 | 0.570 | 0.030 | 0.142 | 0.000 | ||
| 7 spectra, DLTDAFLAEVEK | 0.000 | 0.000 | 0.000 | 0.290 | 0.620 | 0.003 | 0.087 | 0.000 | ||
| 15 spectra, IPGLADK | 0.000 | 0.000 | 0.000 | 0.180 | 0.707 | 0.000 | 0.073 | 0.040 | ||
| 6 spectra, YGDVFSLQK | 0.000 | 0.000 | 0.000 | 0.198 | 0.674 | 0.001 | 0.103 | 0.024 | ||
| 3 spectra, SQGVILASYGPEWR | 0.000 | 0.000 | 0.030 | 0.154 | 0.685 | 0.037 | 0.096 | 0.000 | ||
| 25 spectra, GWKPMVIVNR | 0.000 | 0.000 | 0.000 | 0.207 | 0.658 | 0.000 | 0.135 | 0.000 | ||
| 13 spectra, SLEEWVTK | 0.000 | 0.000 | 0.054 | 0.198 | 0.523 | 0.000 | 0.225 | 0.000 |
| Plot | Mito | Lyso or Perox | ER | Golgi | PM | Cytosol | Nucleus | ||||||
| Expt B |
19 peptides |
89 spectra |
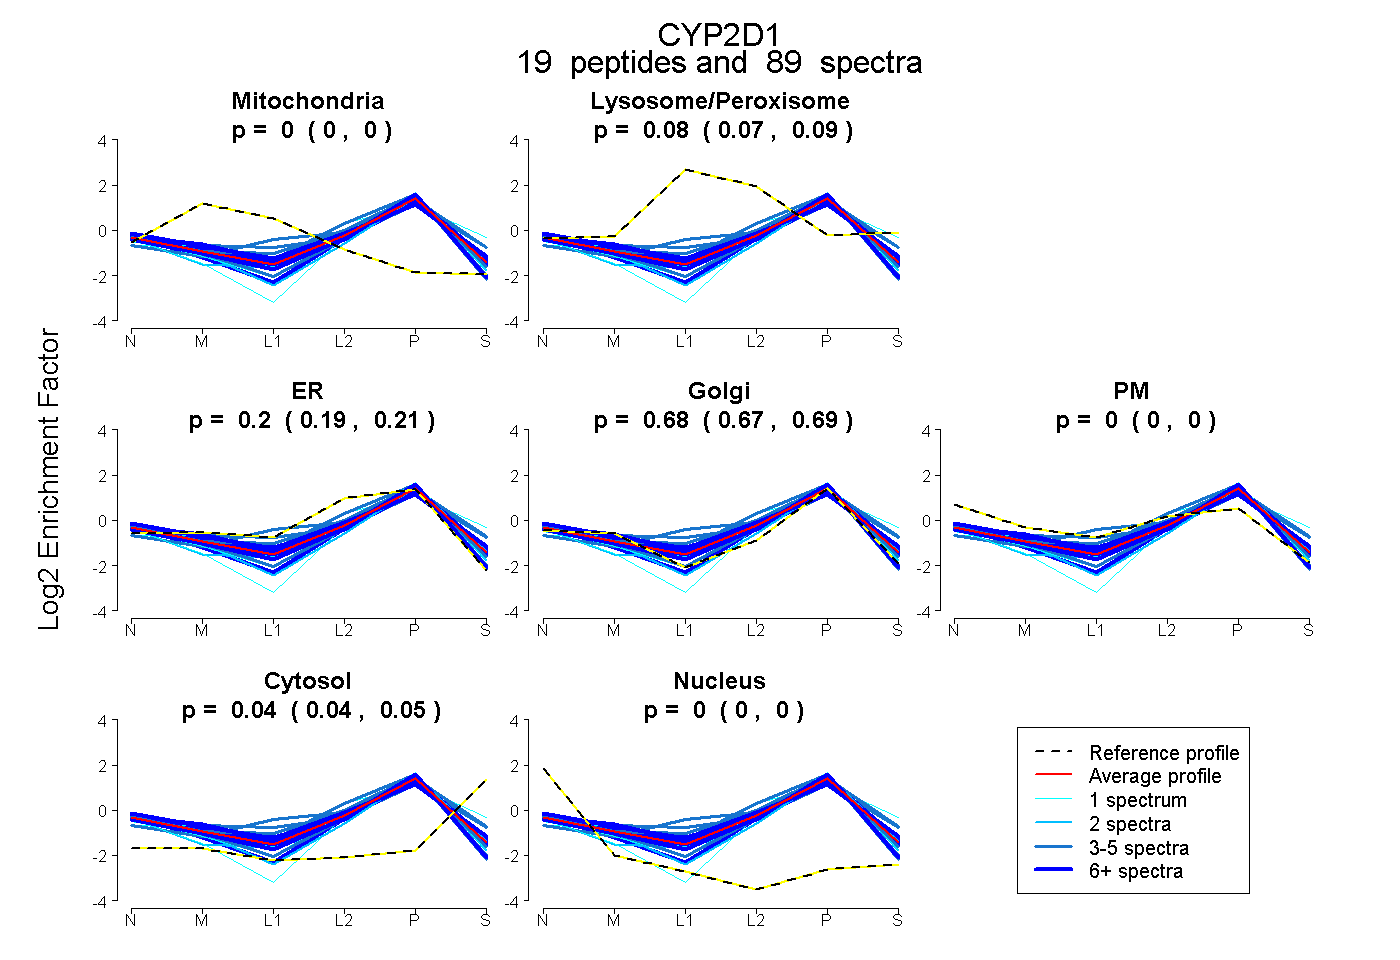 |
0.000 0.000 | 0.000 |
0.081 0.074 | 0.086 |
0.198 0.186 | 0.209 |
0.678 0.668 | 0.686 |
0.000 0.000 | 0.000 |
0.043 0.040 | 0.047 |
0.000 0.000 | 0.000 |
|||
| Plot | Lyso | Other | |||||||||||
| Expt C |
16 peptides |
230 spectra |
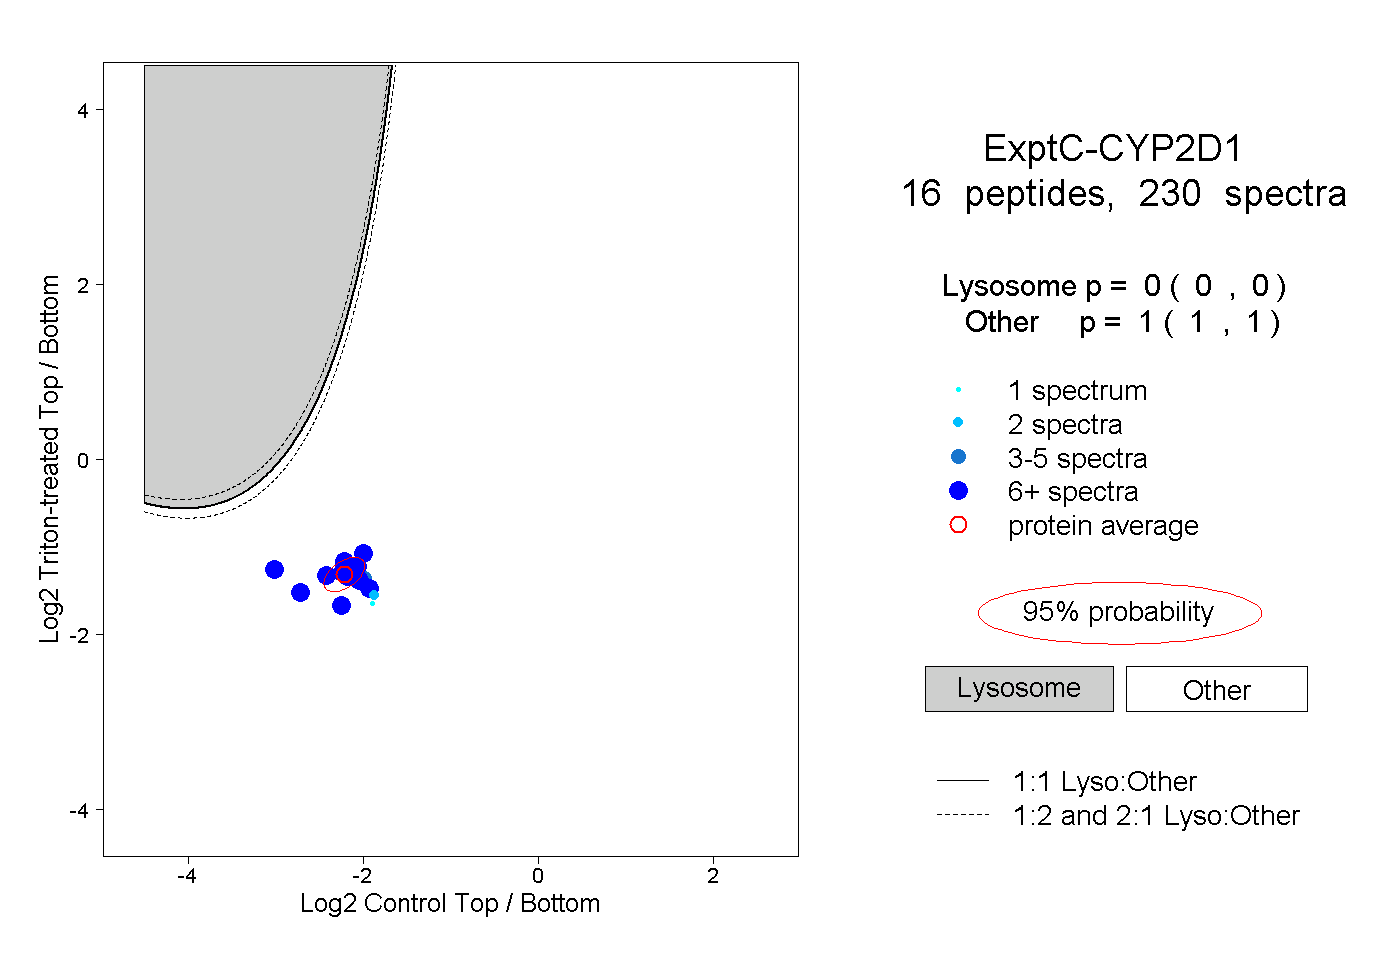 |
0.000 0.000 | 0.000 |
1.000 1.000 | 1.000 |
||||||||
| Plot | Lyso | Other | |||||||||||
| Expt D |
9 peptides |
36 spectra |
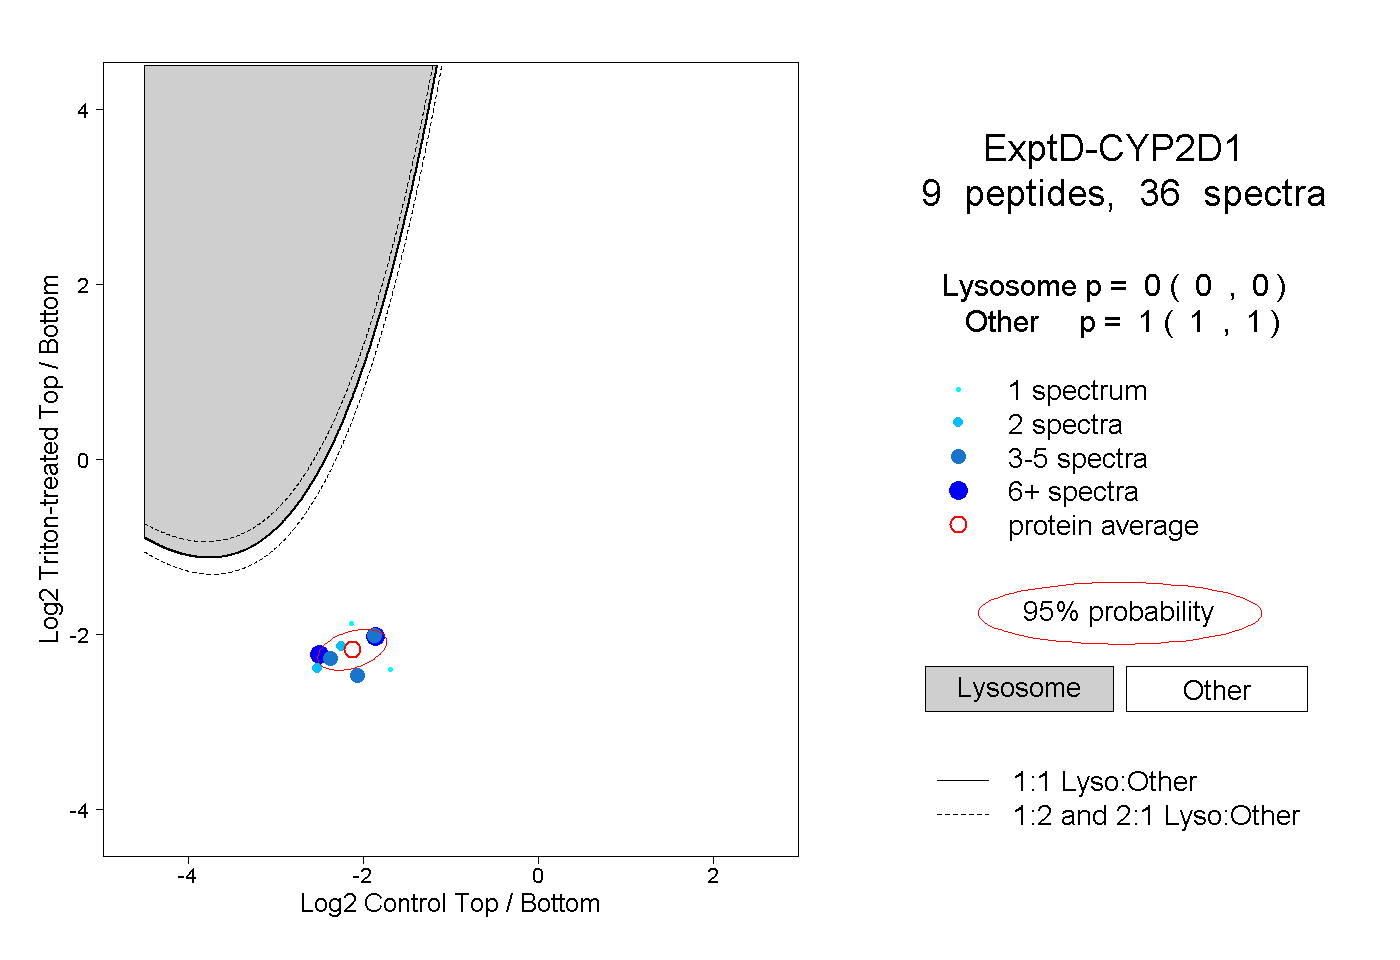 |
0.000 0.000 | 0.000 |
1.000 1.000 | 1.000 |