 2
2peptides
spectra
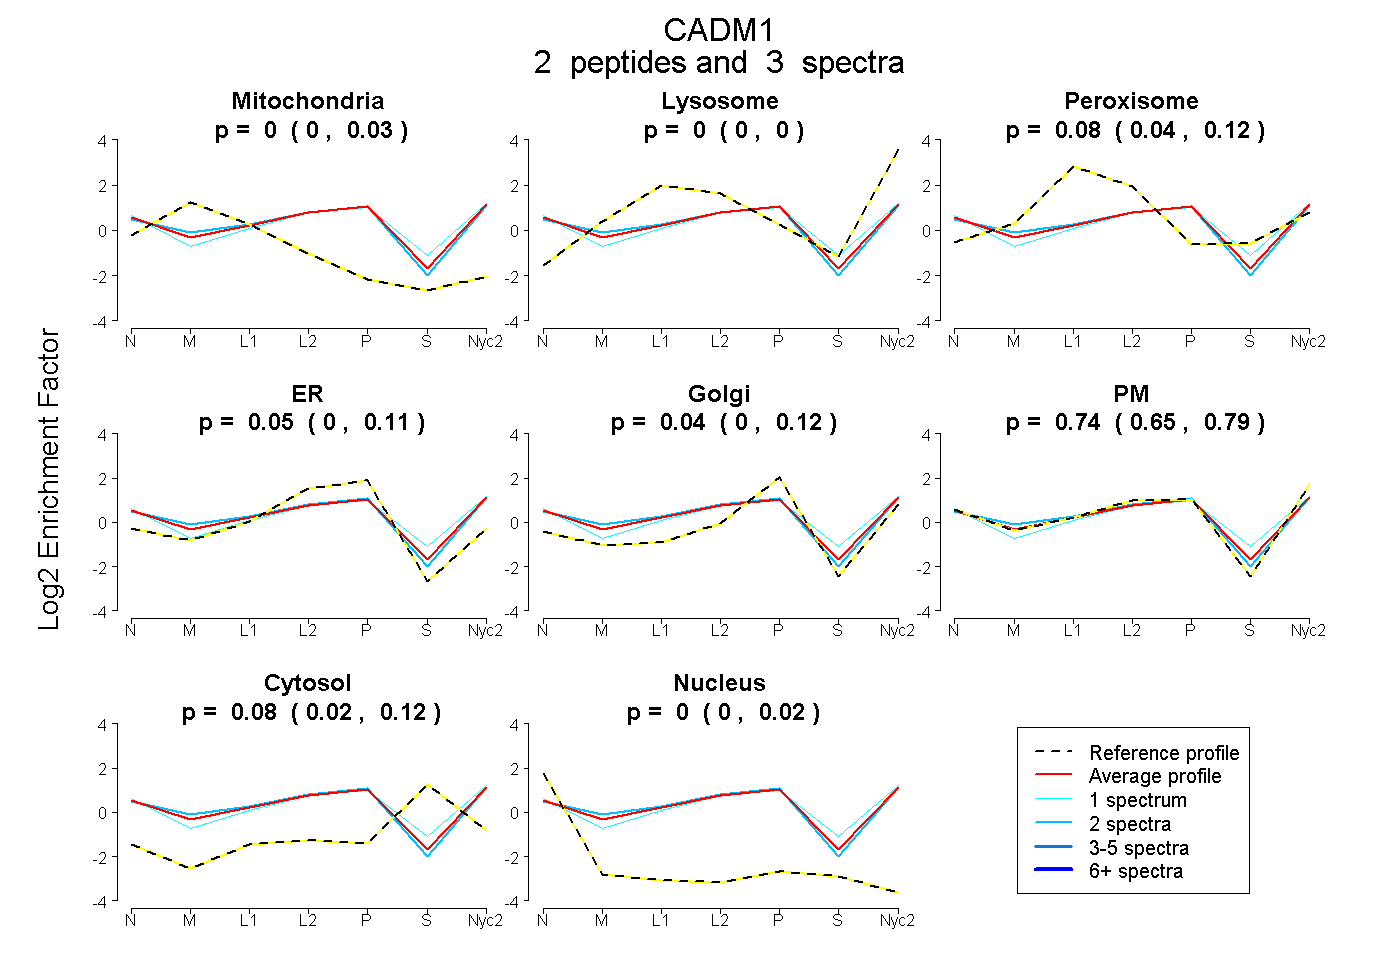
0.000 | 0.034
0.000 | 0.000
0.038 | 0.122
0.000 | 0.108
0.000 | 0.115
0.653 | 0.793
0.023 | 0.116
0.000 | 0.017
1peptide
spectrum
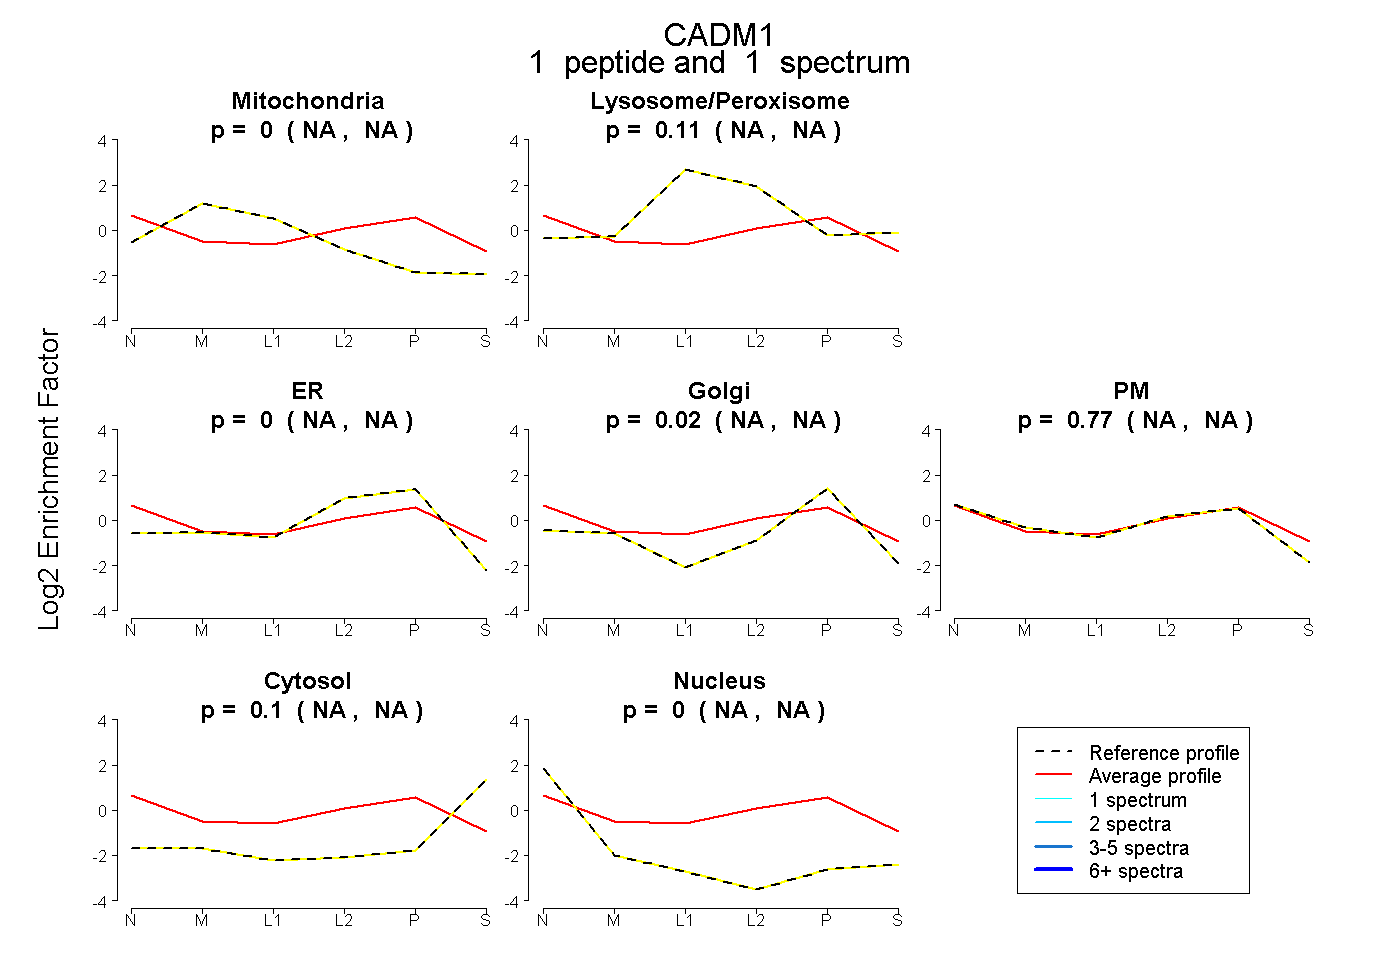
NA | NA
NA | NA
NA | NA
NA | NA
NA | NA
NA | NA
NA | NA
5peptides
spectra
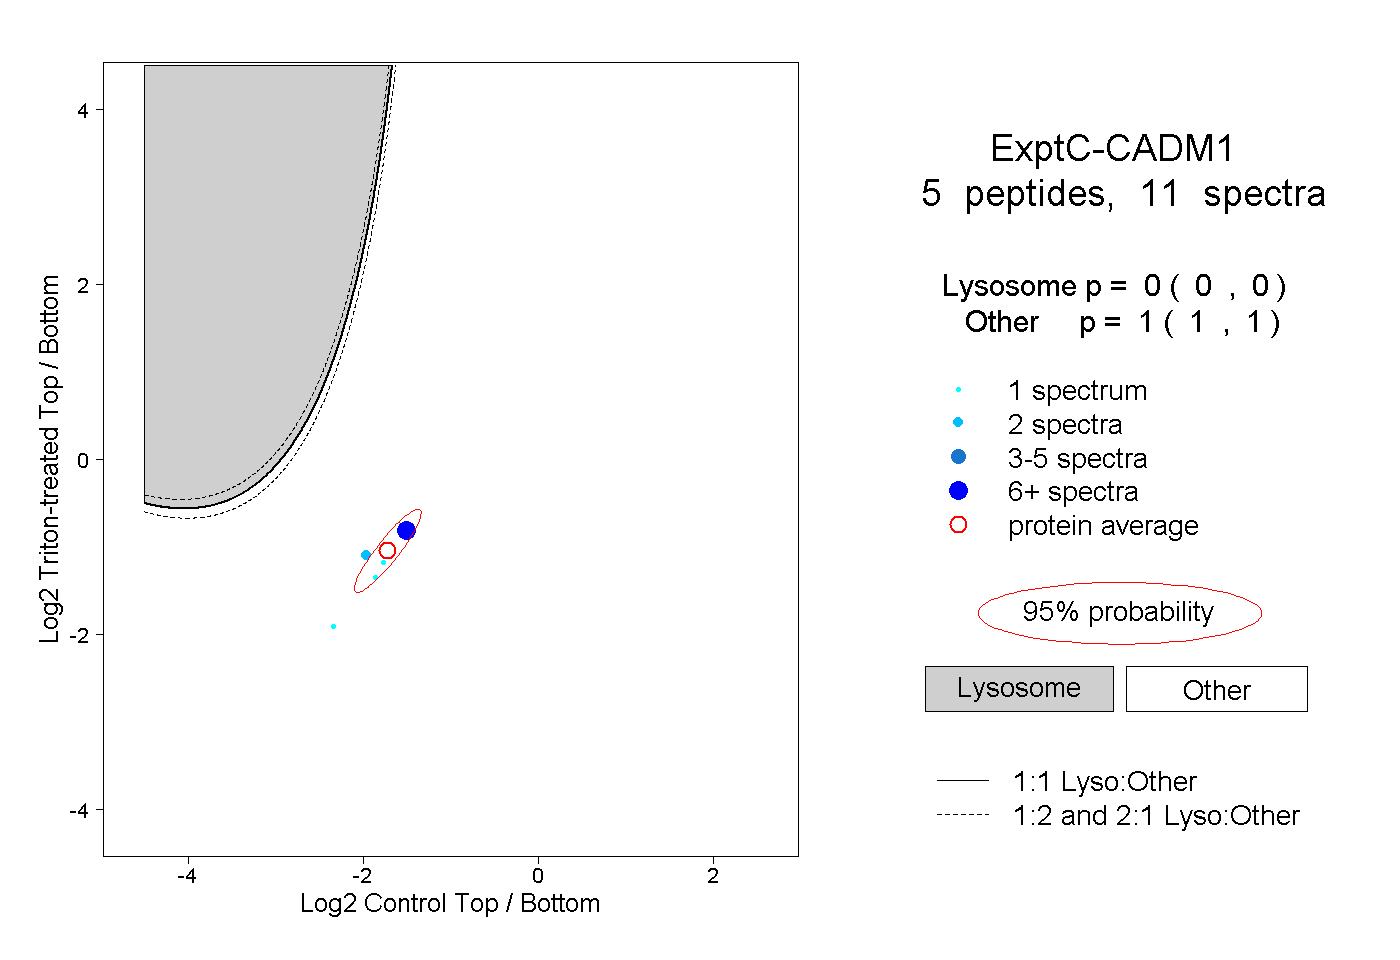
0.000 | 0.000
1.000 | 1.000