 2
2peptides
spectra
0.000 | 0.034
0.000 | 0.000
0.038 | 0.122
0.000 | 0.108
0.000 | 0.115
0.653 | 0.793
0.023 | 0.116
0.000 | 0.017
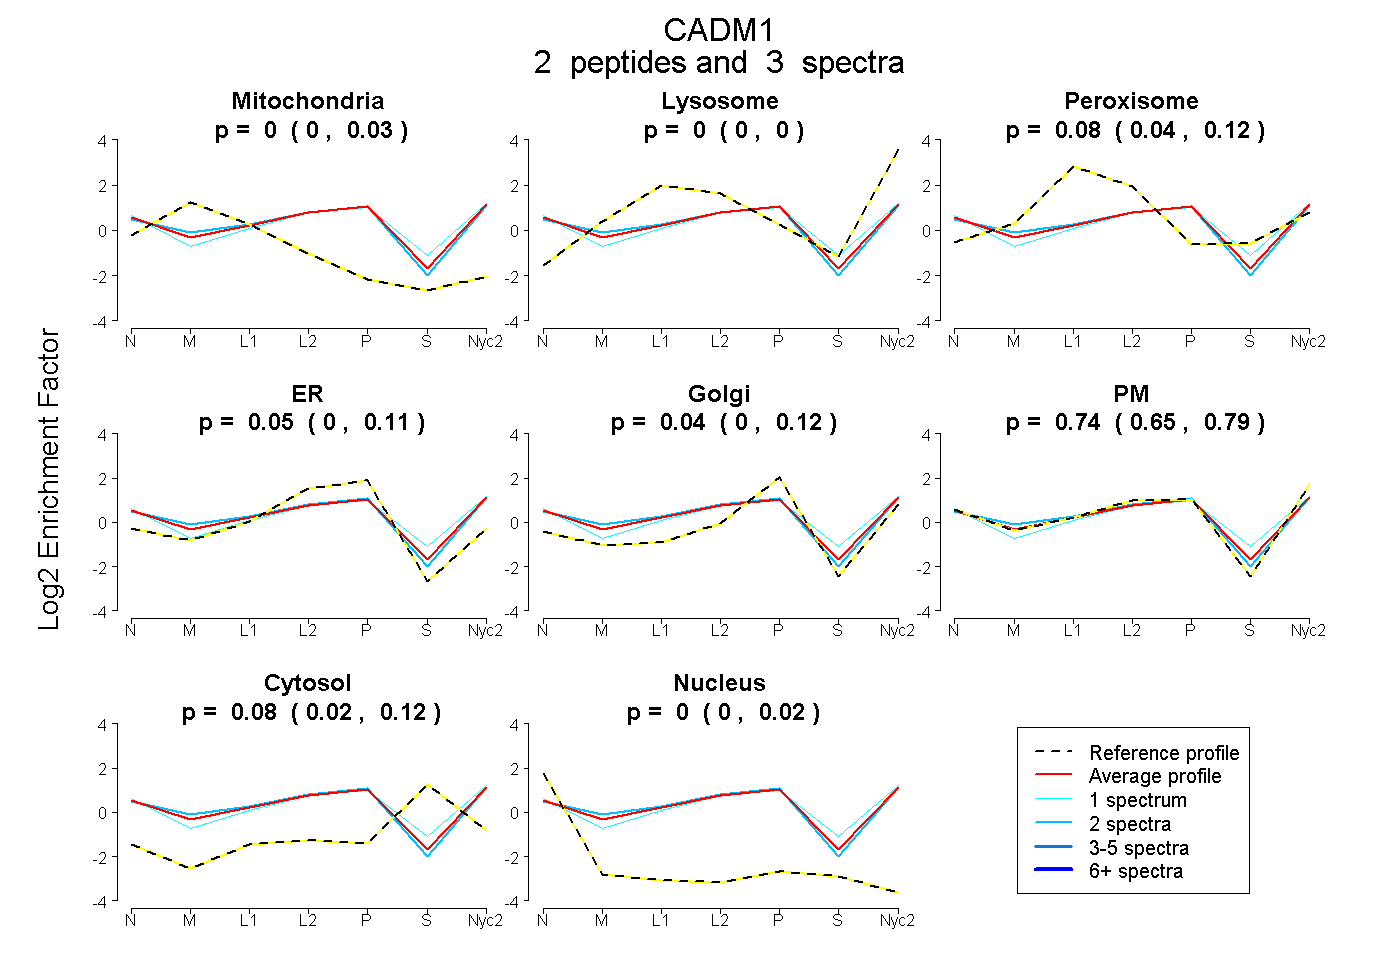
| Plot | Mito | Lyso | Perox | ER | Golgi | PM | Cytosol | Nucleus | |||||
| Expt A |
2 peptides |
3 spectra |
|
0.000 0.000 | 0.034 |
0.000 0.000 | 0.000 |
0.080 0.038 | 0.122 |
0.054 0.000 | 0.108 |
0.039 0.000 | 0.115 |
0.743 0.653 | 0.793 |
0.084 0.023 | 0.116 |
0.000 0.000 | 0.017 |
| 1 spectrum, QTIYFR | 0.000 | 0.000 | 0.060 | 0.000 | 0.000 | 0.769 | 0.172 | 0.000 | ||
| 2 spectra, SDDSVIQLLNPNR | 0.050 | 0.000 | 0.099 | 0.032 | 0.133 | 0.678 | 0.008 | 0.000 |
| Plot | Mito | Lyso or Perox | ER | Golgi | PM | Cytosol | Nucleus | ||||||
| Expt B |
1 peptide |
1 spectrum |
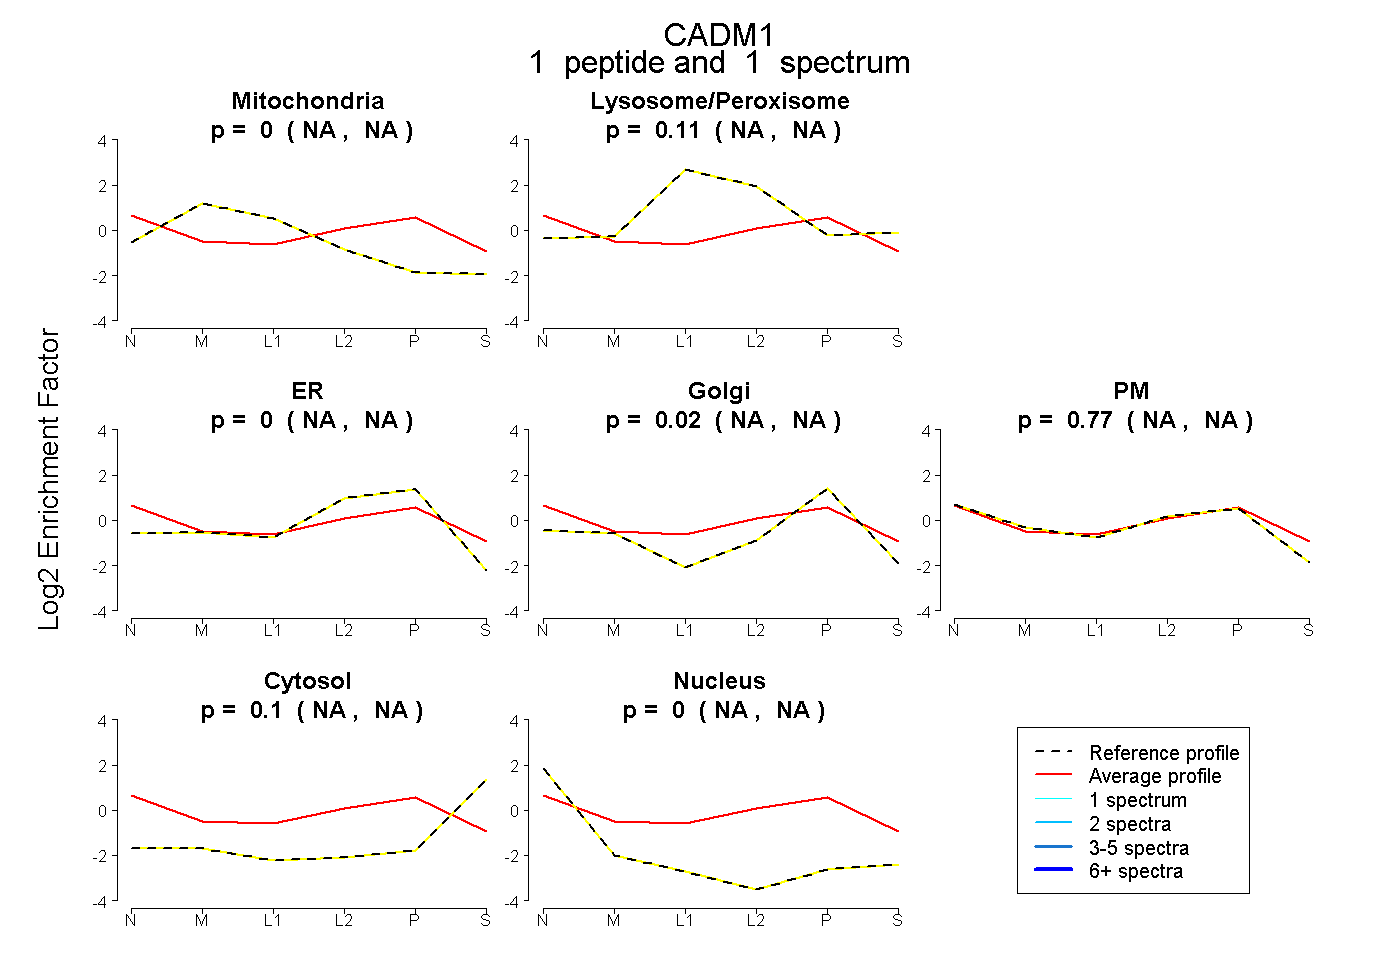 |
0.000 NA | NA |
0.107 NA | NA |
0.000 NA | NA |
0.020 NA | NA |
0.773 NA | NA |
0.100 NA | NA |
0.000 NA | NA |
|||
| Plot | Lyso | Other | |||||||||||
| Expt C |
5 peptides |
11 spectra |
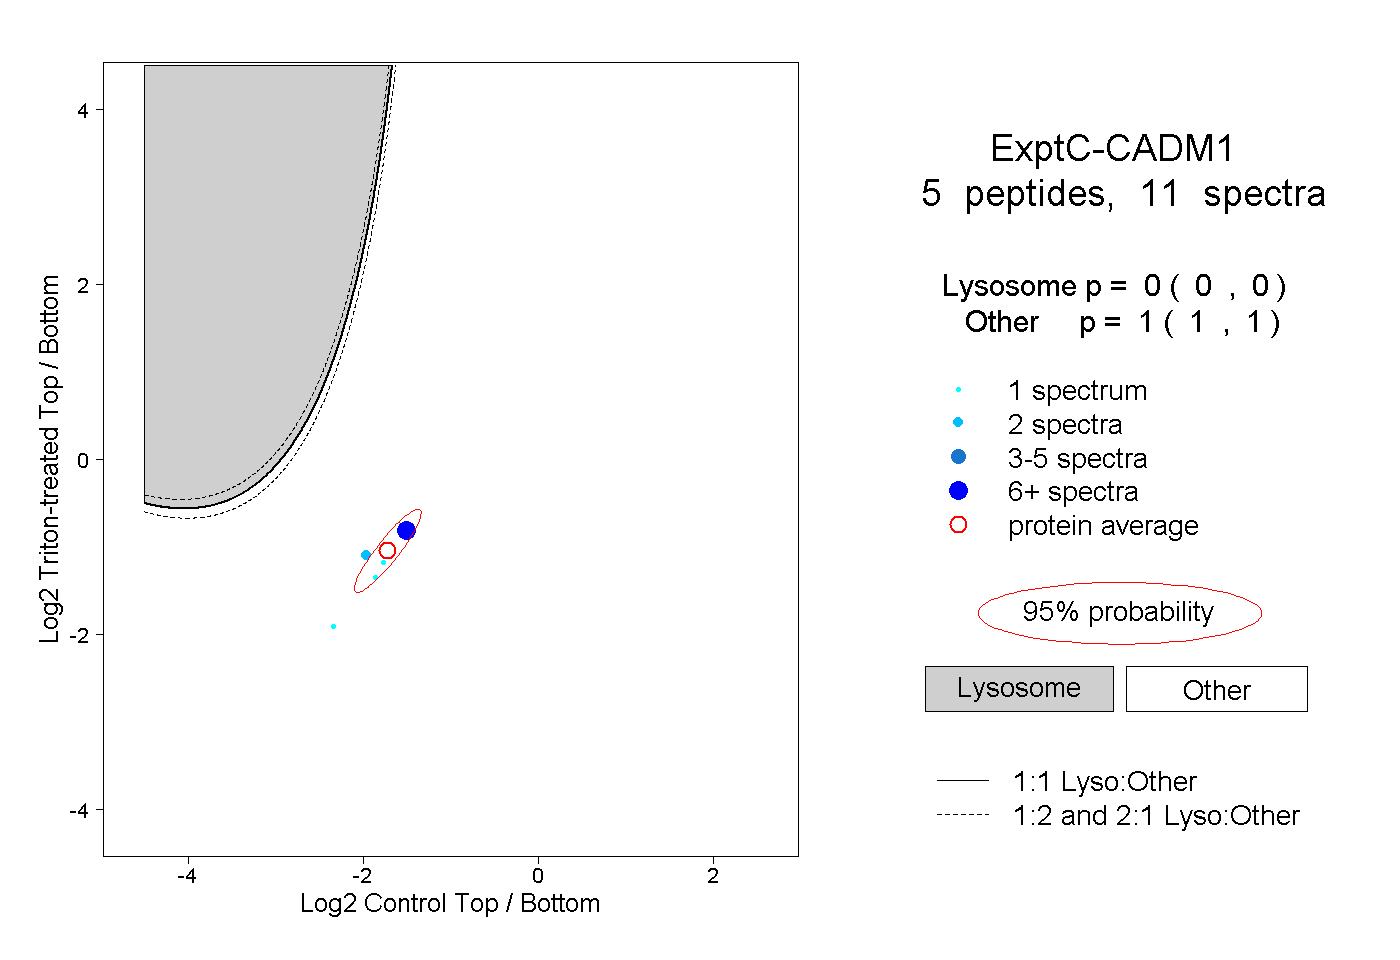 |
0.000 0.000 | 0.000 |
1.000 1.000 | 1.000 |