 21
21peptides
spectra
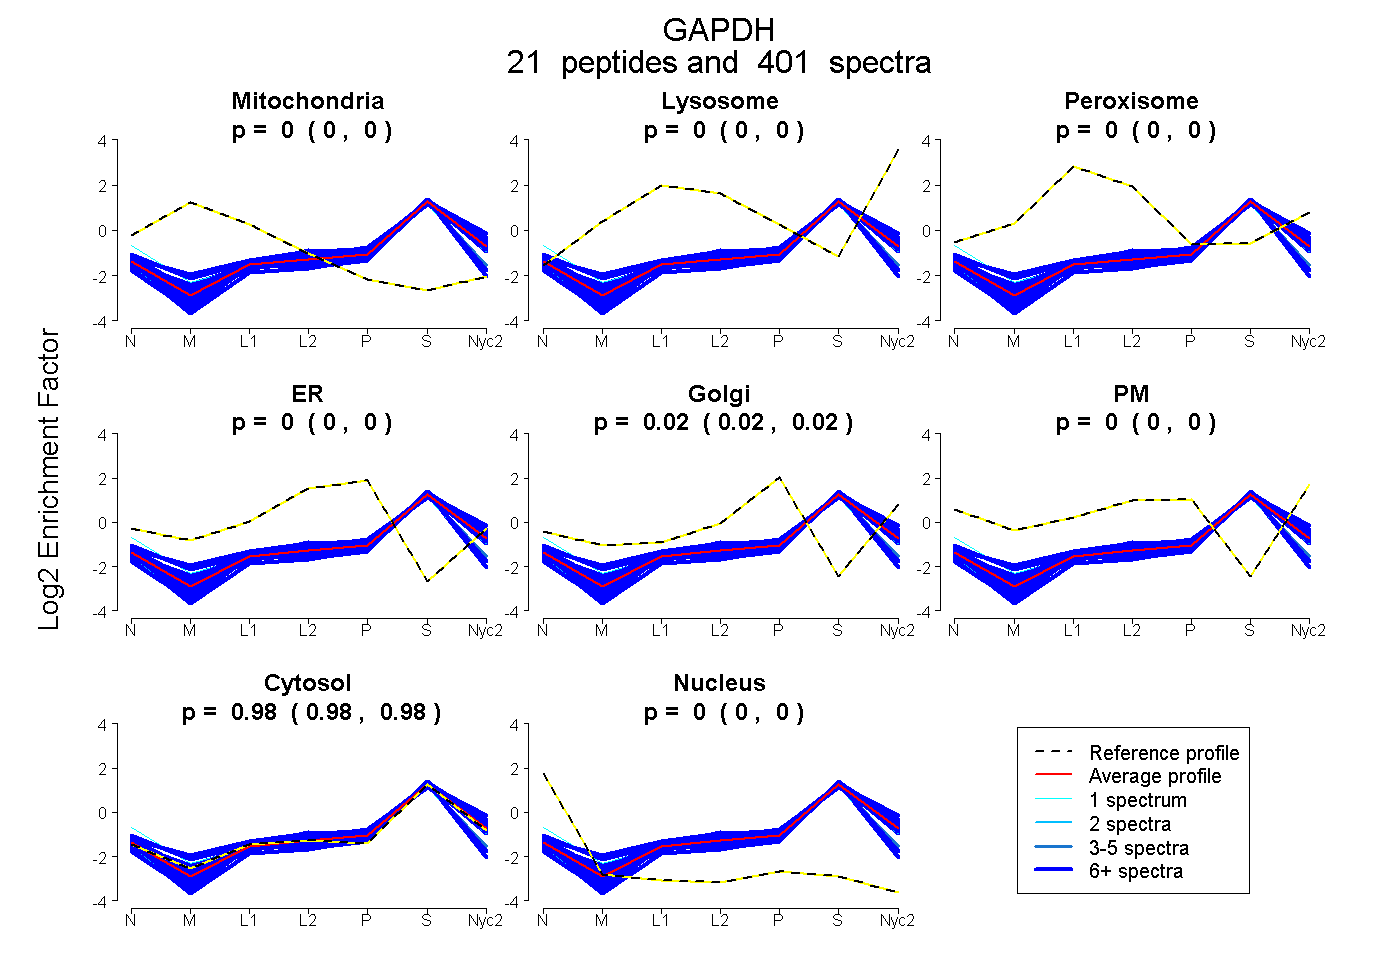
0.000 | 0.000
0.000 | 0.000
0.000 | 0.000
0.000 | 0.000
0.021 | 0.022
0.000 | 0.000
0.978 | 0.979
0.000 | 0.000
14peptides
spectra
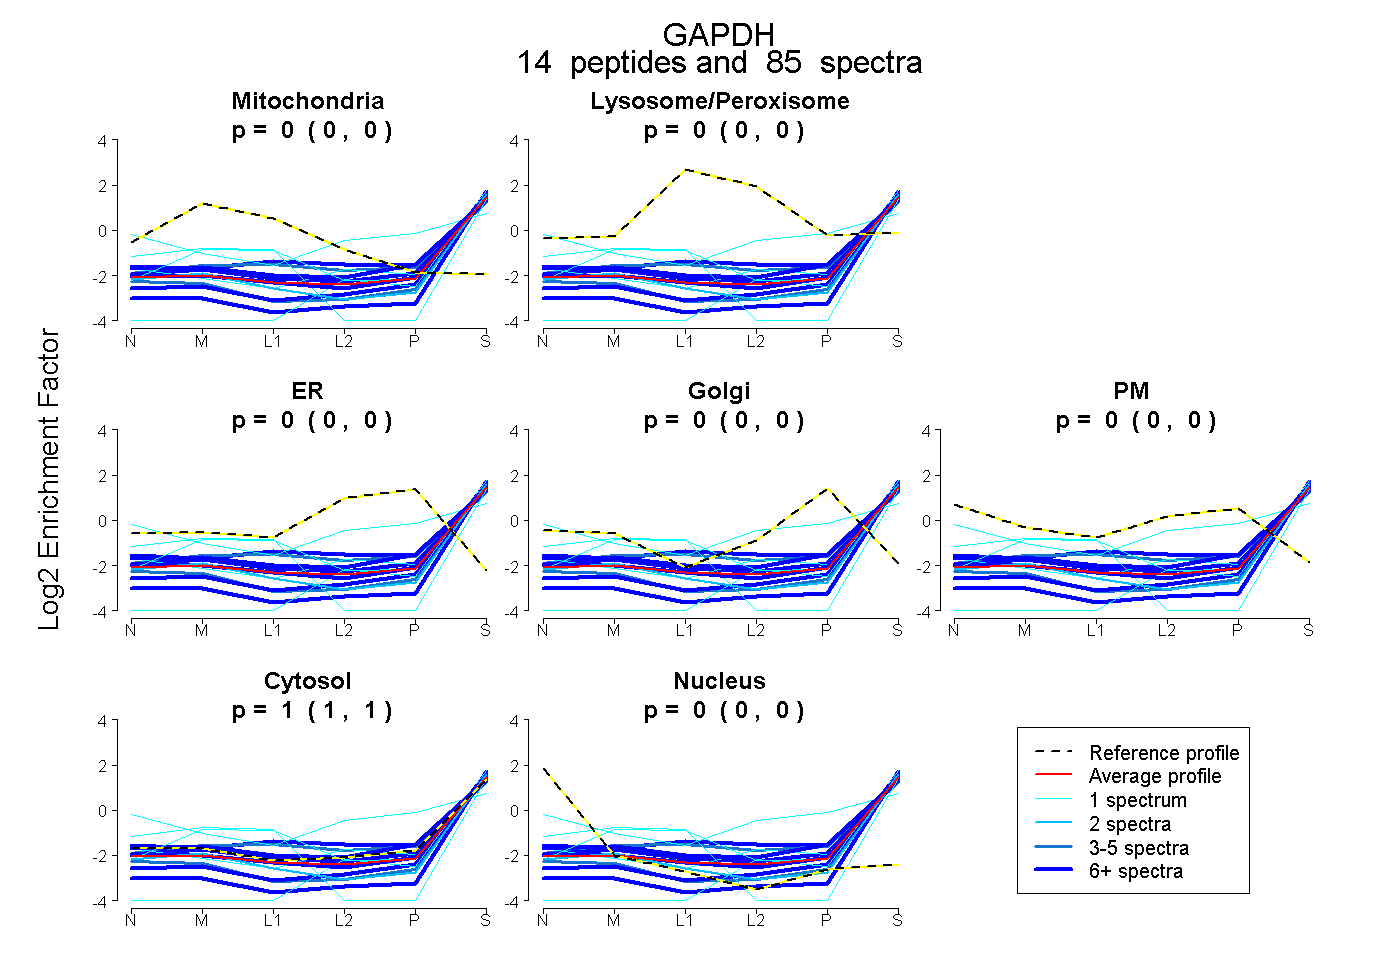
0.000 | 0.000
0.000 | 0.000
0.000 | 0.000
0.000 | 0.000
0.000 | 0.000
1.000 | 1.000
0.000 | 0.000
19peptides
spectra
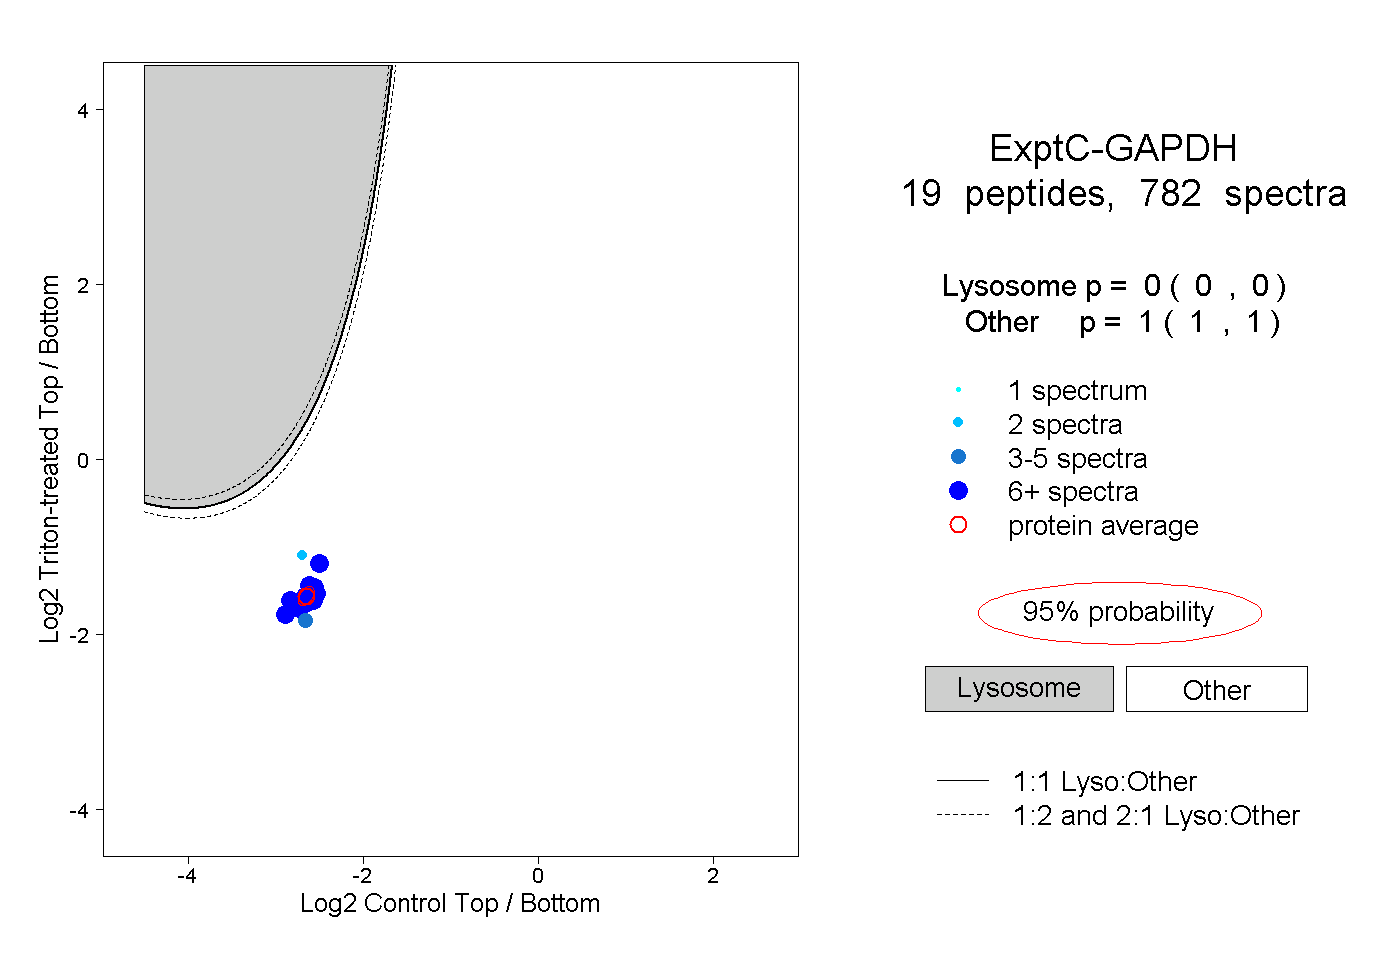
0.000 | 0.000
1.000 | 1.000
12peptides
spectra
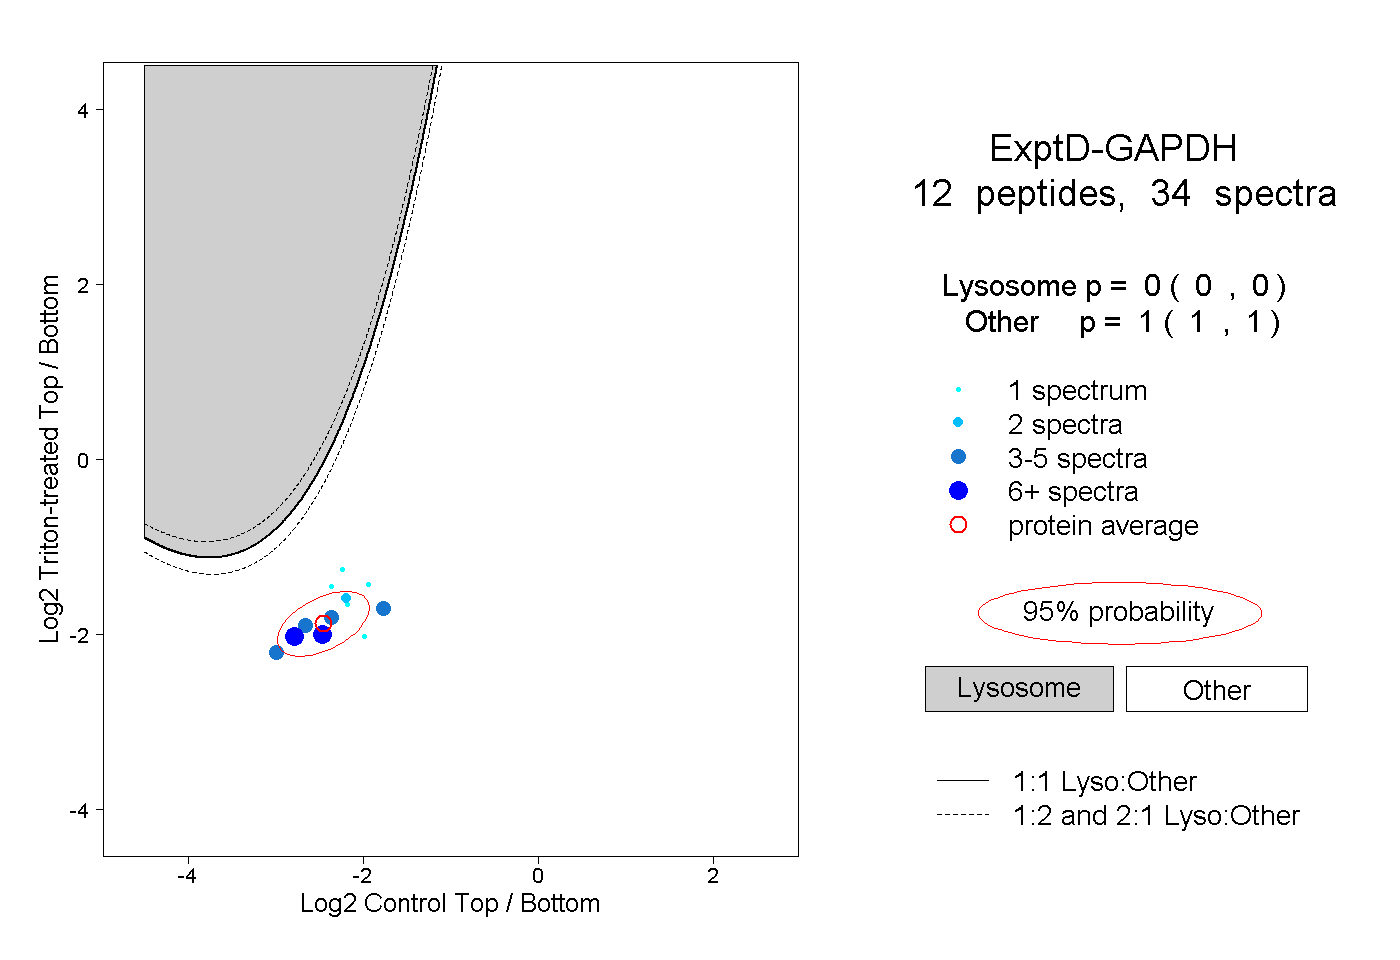
0.000 | 0.000
1.000 | 1.000