| 4 spectra, AGAHLK |
0.000 |
|
0.000 |
|
0.000 |
0.000 |
0.000 |
1.000 |
0.000 |
|
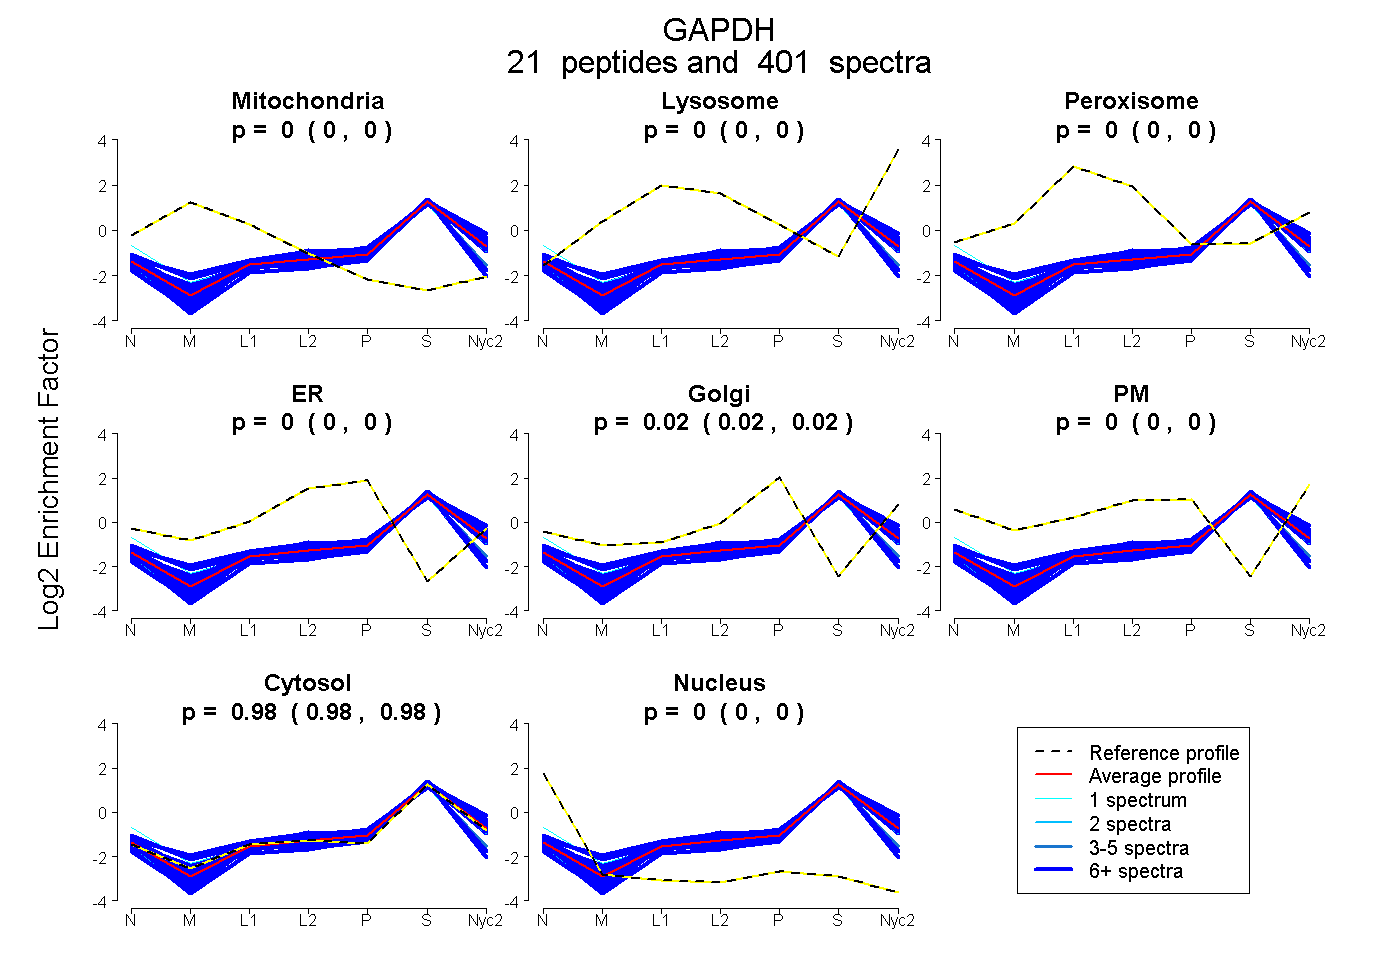
| 9 spectra, VGVNGFGR |
0.000 |
|
0.026 |
|
0.000 |
0.020 |
0.000 |
0.954 |
0.000 |
|
| 9 spectra, LISWYDNEYGYSNR |
0.000 |
|
0.000 |
|
0.000 |
0.000 |
0.000 |
1.000 |
0.000 |
|
| 2 spectra, YDNSLK |
0.000 |
|
0.000 |
|
0.000 |
0.000 |
0.000 |
1.000 |
0.000 |
|
| 6 spectra, VPTPNVSVVDLTCR |
0.000 |
|
0.000 |
|
0.000 |
0.000 |
0.000 |
1.000 |
0.000 |
|
| 1 spectrum, LTGTAFR |
0.000 |
|
0.104 |
|
0.000 |
0.034 |
0.359 |
0.503 |
0.000 |
|
| 1 spectrum, VIPELNGK |
0.101 |
|
0.000 |
|
0.000 |
0.000 |
0.000 |
0.756 |
0.143 |
|
| 23 spectra, LTGMAFR |
0.000 |
|
0.000 |
|
0.000 |
0.000 |
0.000 |
1.000 |
0.000 |
|
| 1 spectrum, VVDLMAYMASK |
0.141 |
|
0.038 |
|
0.000 |
0.000 |
0.000 |
0.821 |
0.000 |
|
| 1 spectrum, VIHDNFGIVEGLMTTVHAITATQK |
0.000 |
|
0.000 |
|
0.000 |
0.000 |
0.000 |
1.000 |
0.000 |
|
| 5 spectra, IVSNASCTTNCLAPLAK |
0.000 |
|
0.107 |
|
0.000 |
0.000 |
0.000 |
0.893 |
0.000 |
|
| 16 spectra, GAAQNIIPASTGAAK |
0.000 |
|
0.143 |
|
0.000 |
0.000 |
0.000 |
0.857 |
0.000 |
|
| 6 spectra, LVINGKPITIFQER |
0.000 |
|
0.000 |
|
0.000 |
0.000 |
0.000 |
1.000 |
0.000 |
|
| 1 spectrum, TVDGPSGK |
0.000 |
|
0.000 |
|
0.000 |
0.000 |
0.000 |
1.000 |
0.000 |
|
 21
21