 21
21peptides
spectra
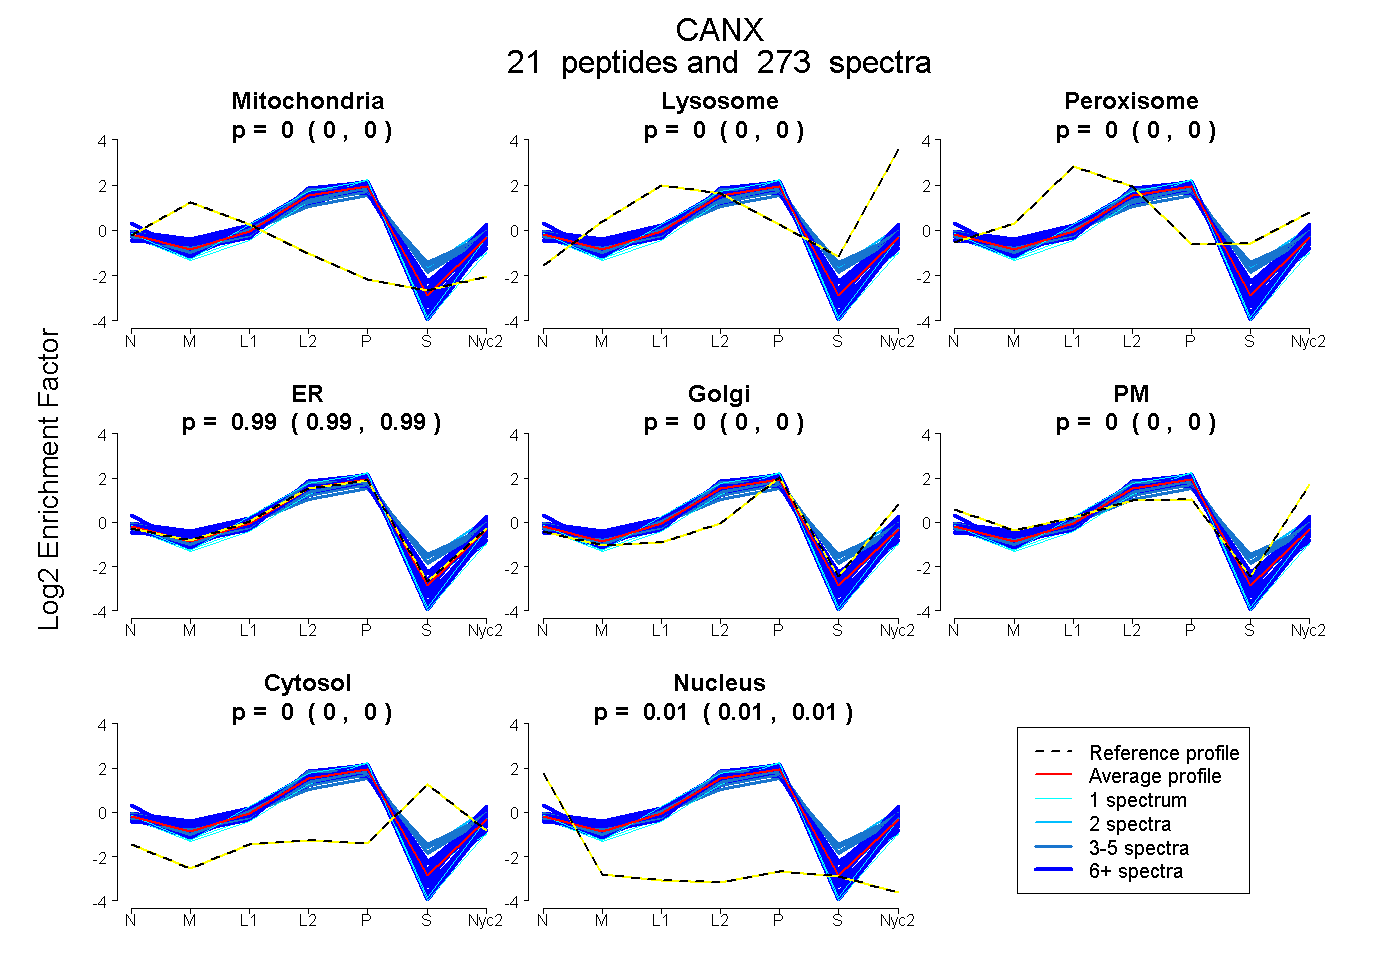
0.000 | 0.000
0.000 | 0.000
0.000 | 0.000
0.989 | 0.990
0.000 | 0.000
0.000 | 0.000
0.000 | 0.000
0.010 | 0.011
16peptides
spectra
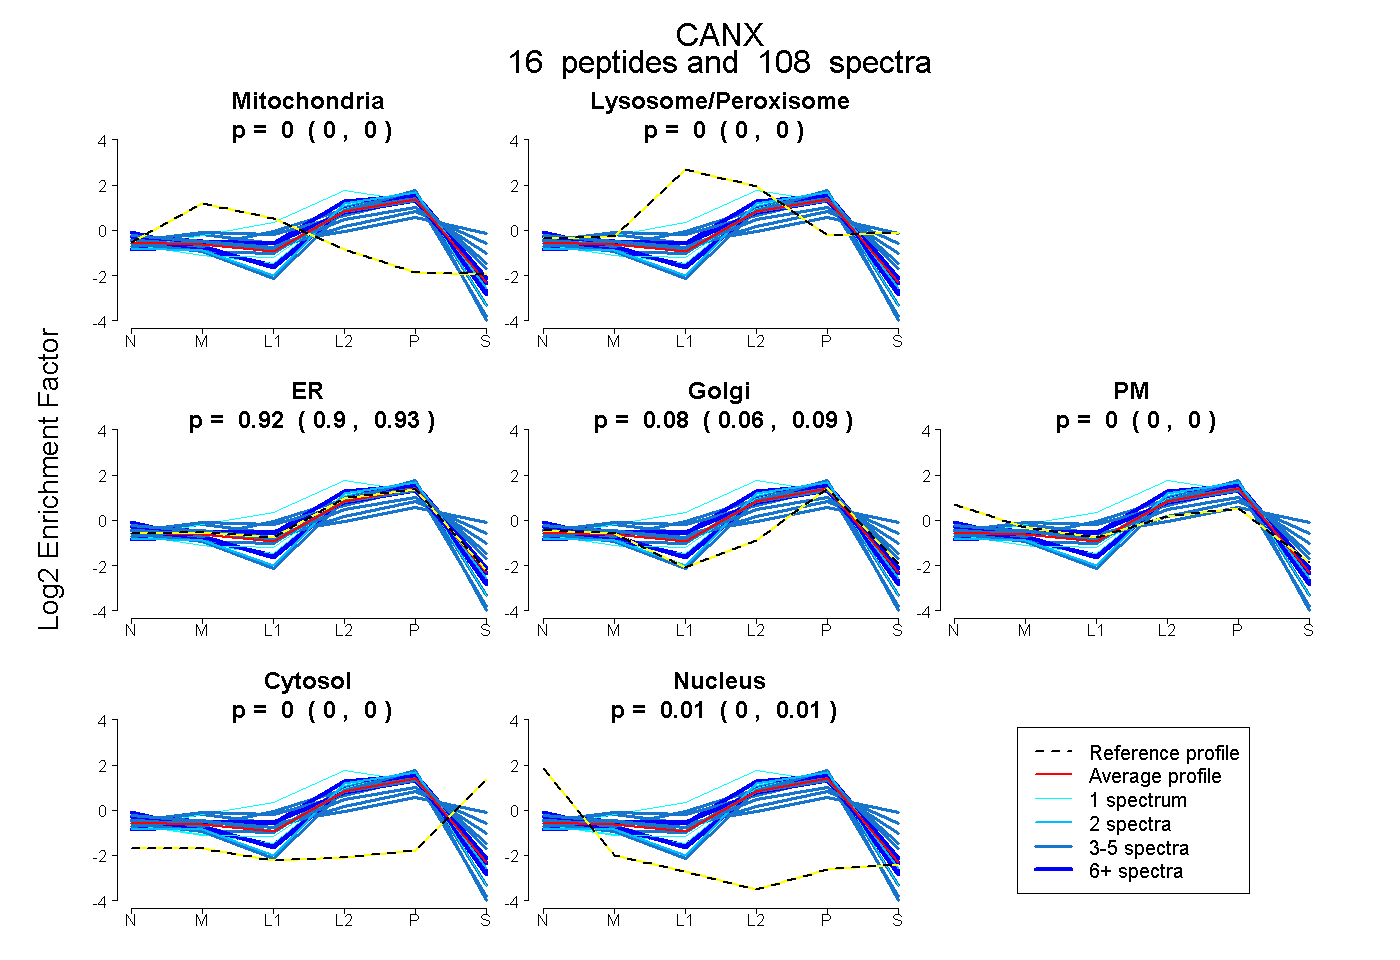
0.000 | 0.000
0.000 | 0.000
0.904 | 0.927
0.063 | 0.090
0.000 | 0.000
0.000 | 0.000
0.002 | 0.009
22peptides
spectra
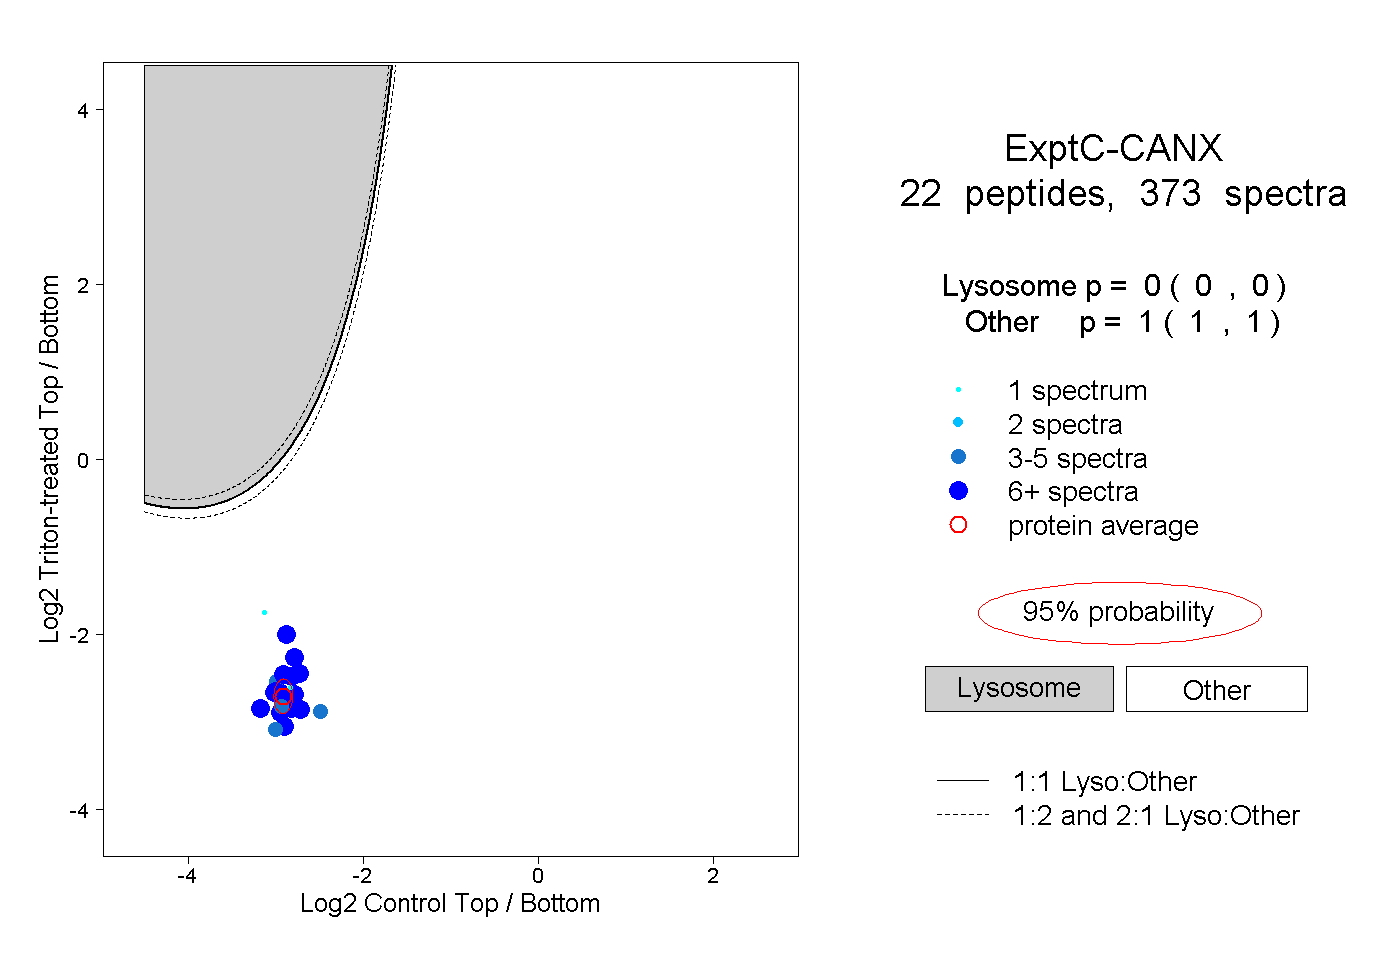
0.000 | 0.000
1.000 | 1.000
12peptides
spectra
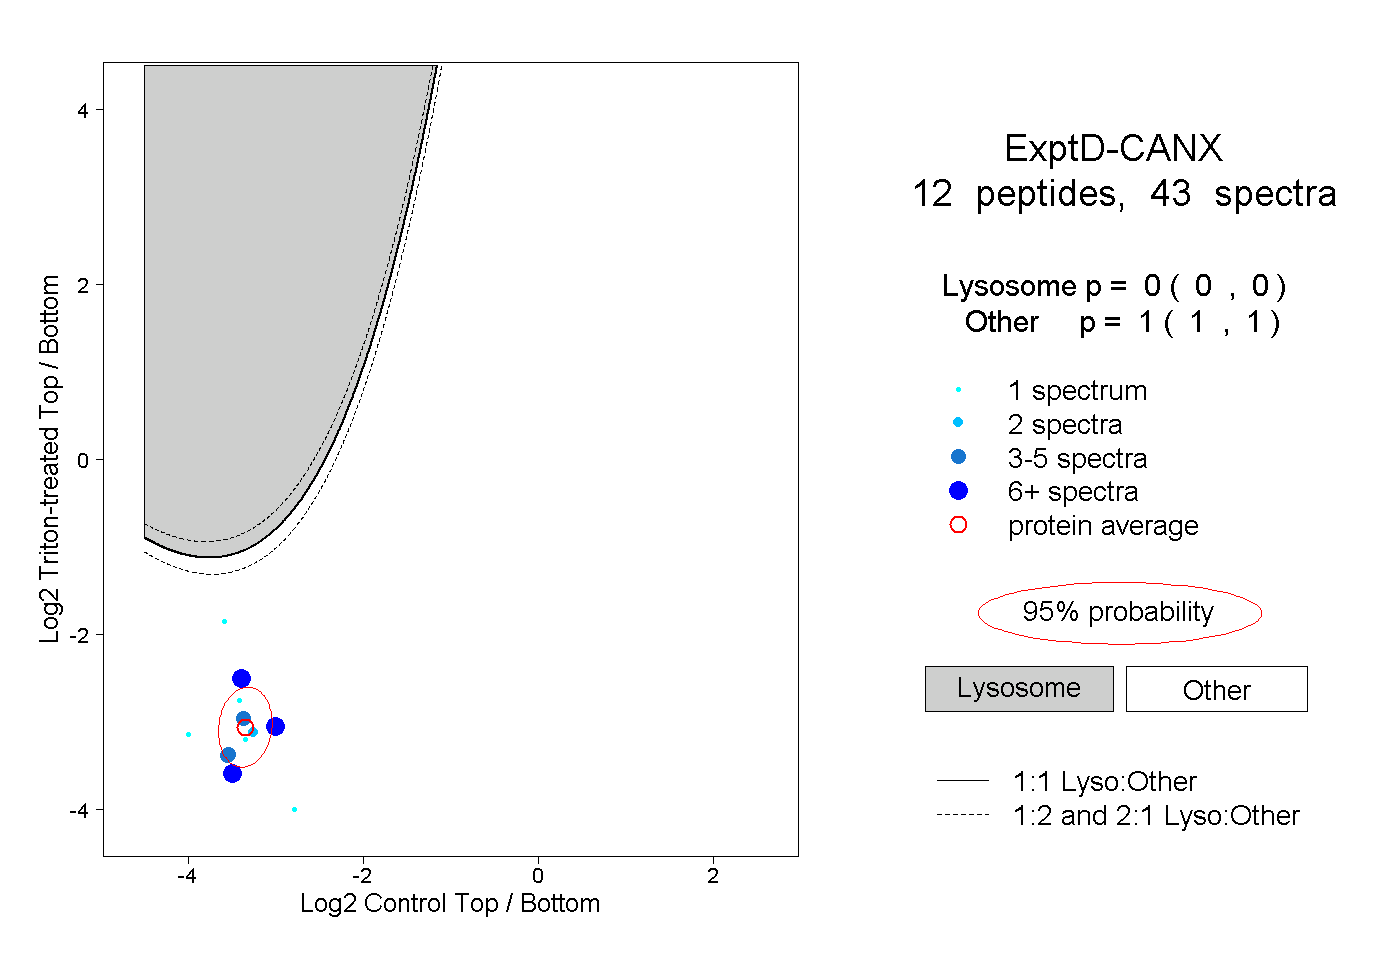
0.000 | 0.000
1.000 | 1.000