 21
21peptides
spectra
0.000 | 0.000
0.000 | 0.000
0.000 | 0.000
0.989 | 0.990
0.000 | 0.000
0.000 | 0.000
0.000 | 0.000
0.010 | 0.011
| Plot | Mito | Lyso | Perox | ER | Golgi | PM | Cytosol | Nucleus | |||||
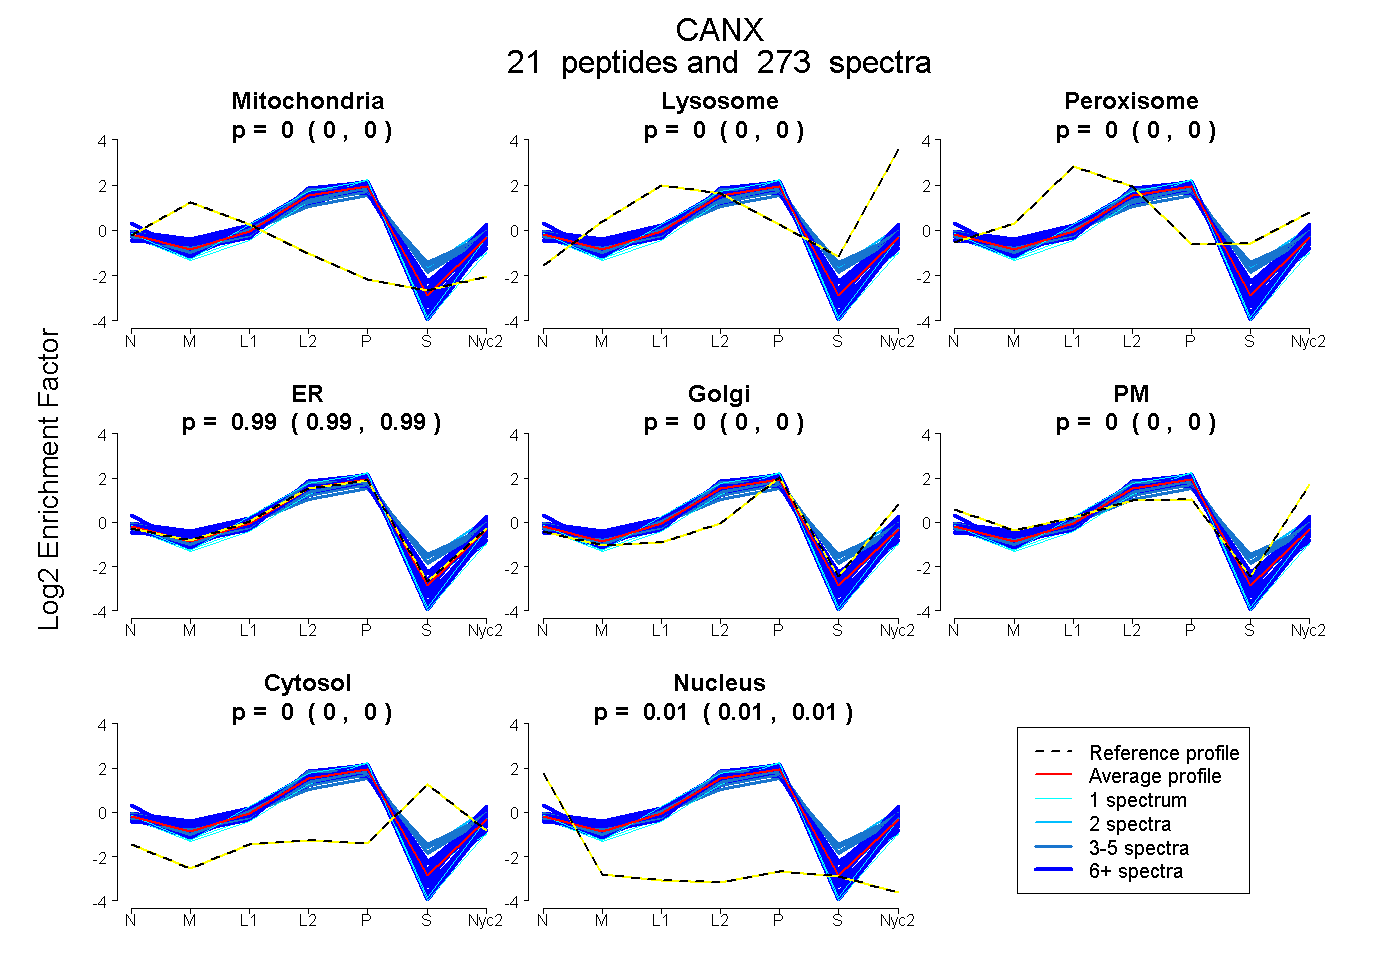
| Expt A |
21 peptides |
273 spectra |
|
0.000 0.000 | 0.000 |
0.000 0.000 | 0.000 |
0.000 0.000 | 0.000 |
0.989 0.989 | 0.990 |
0.000 0.000 | 0.000 |
0.000 0.000 | 0.000 |
0.000 0.000 | 0.000 |
0.011 0.010 | 0.011 |
| 17 spectra, LHFIFR | 0.000 | 0.000 | 0.000 | 1.000 | 0.000 | 0.000 | 0.000 | 0.000 | ||
| 4 spectra, KPEDWDERPK | 0.000 | 0.000 | 0.106 | 0.721 | 0.081 | 0.000 | 0.092 | 0.000 | ||
| 7 spectra, IPNPDFFEDLEPFR | 0.000 | 0.000 | 0.000 | 1.000 | 0.000 | 0.000 | 0.000 | 0.000 | ||
| 26 spectra, WEVDEMK | 0.000 | 0.010 | 0.000 | 0.922 | 0.068 | 0.000 | 0.000 | 0.000 | ||
| 19 spectra, QSNAMEYK | 0.000 | 0.000 | 0.000 | 0.983 | 0.000 | 0.000 | 0.000 | 0.017 | ||
| 10 spectra, TSELNLDQFHDK | 0.000 | 0.000 | 0.000 | 0.875 | 0.013 | 0.083 | 0.029 | 0.000 | ||
| 11 spectra, APVPTGEVYFADSFDR | 0.000 | 0.000 | 0.000 | 1.000 | 0.000 | 0.000 | 0.000 | 0.000 | ||
| 35 spectra, AEEDEILNR | 0.000 | 0.000 | 0.000 | 0.920 | 0.000 | 0.000 | 0.000 | 0.080 | ||
| 5 spectra, GSLSGWILSK | 0.000 | 0.000 | 0.064 | 0.684 | 0.046 | 0.047 | 0.158 | 0.000 | ||
| 14 spectra, TGVYEEK | 0.000 | 0.000 | 0.000 | 0.890 | 0.032 | 0.078 | 0.000 | 0.000 | ||
| 1 spectrum, EIEDPEDR | 0.000 | 0.000 | 0.000 | 0.970 | 0.000 | 0.000 | 0.000 | 0.030 | ||
| 1 spectrum, TDAPQPDVK | 0.000 | 0.000 | 0.000 | 0.853 | 0.118 | 0.000 | 0.000 | 0.029 | ||
| 11 spectra, CGEDYK | 0.000 | 0.000 | 0.000 | 0.950 | 0.000 | 0.000 | 0.041 | 0.009 | ||
| 14 spectra, SDTSTPPSPK | 0.000 | 0.000 | 0.000 | 0.999 | 0.000 | 0.000 | 0.000 | 0.001 | ||
| 27 spectra, GLVLMSR | 0.000 | 0.000 | 0.000 | 0.983 | 0.000 | 0.000 | 0.000 | 0.017 | ||
| 1 spectrum, WKPPMIDNPNYQGIWKPR | 0.000 | 0.000 | 0.000 | 0.986 | 0.000 | 0.000 | 0.000 | 0.014 | ||
| 4 spectra, VVDDWANDGWGLK | 0.000 | 0.000 | 0.028 | 0.869 | 0.012 | 0.000 | 0.091 | 0.000 | ||
| 2 spectra, DDTDDEIAK | 0.000 | 0.086 | 0.000 | 0.749 | 0.054 | 0.000 | 0.111 | 0.000 | ||
| 17 spectra, HHAISAK | 0.000 | 0.026 | 0.024 | 0.738 | 0.000 | 0.212 | 0.000 | 0.000 | ||
| 43 spectra, RPDADLK | 0.049 | 0.000 | 0.000 | 0.946 | 0.000 | 0.005 | 0.000 | 0.000 | ||
| 4 spectra, TYFTDK | 0.000 | 0.053 | 0.000 | 0.878 | 0.000 | 0.000 | 0.070 | 0.000 |
| Plot | Mito | Lyso or Perox | ER | Golgi | PM | Cytosol | Nucleus | ||||||
| Expt B |
16 peptides |
108 spectra |
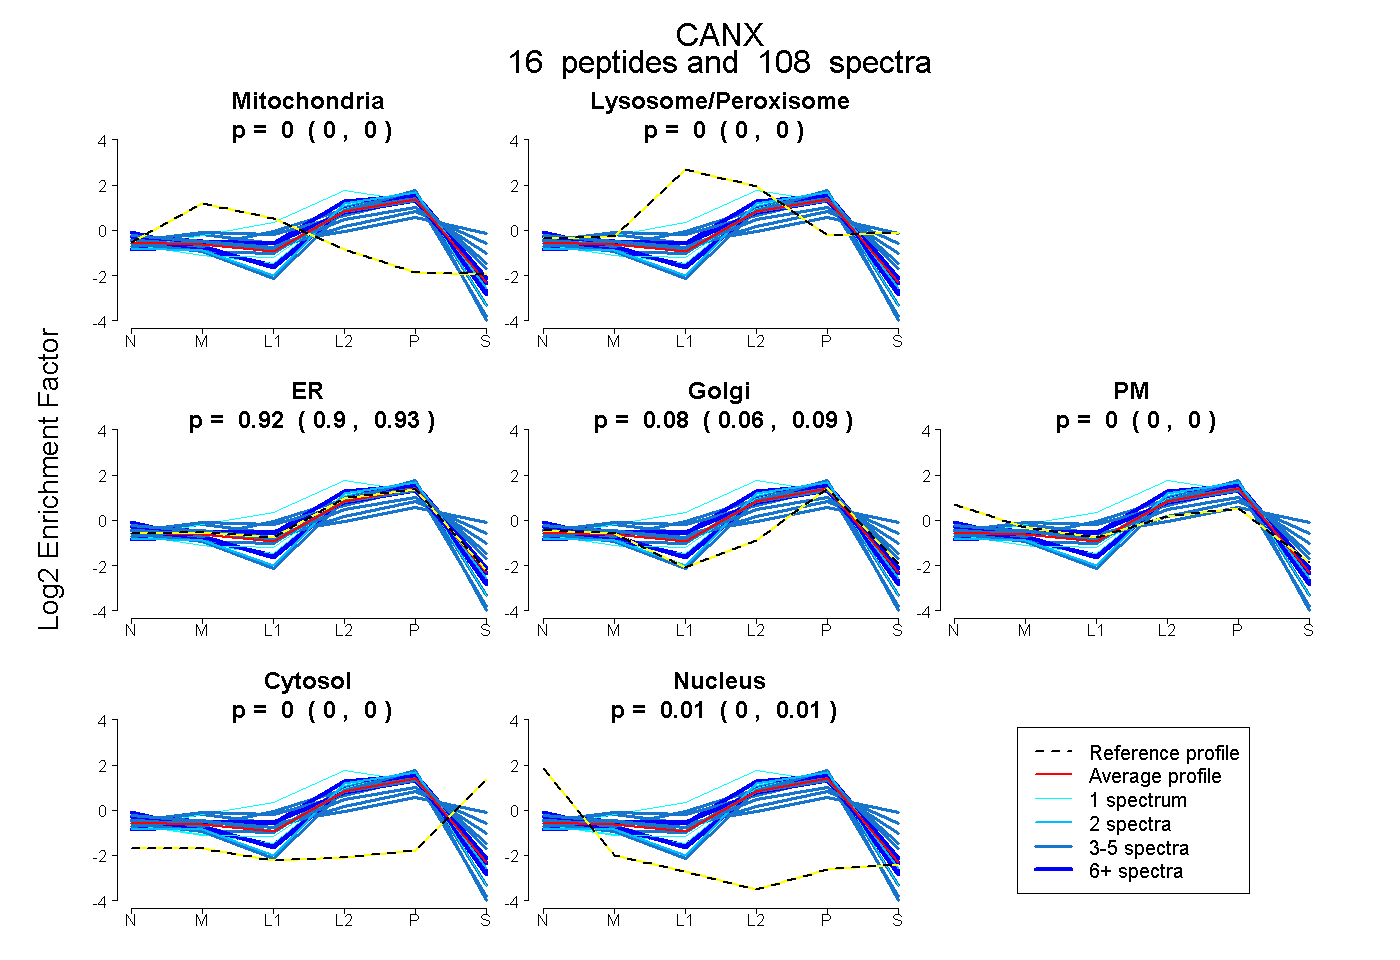 |
0.000 0.000 | 0.000 |
0.000 0.000 | 0.000 |
0.916 0.904 | 0.927 |
0.078 0.063 | 0.090 |
0.000 0.000 | 0.000 |
0.000 0.000 | 0.000 |
0.006 0.002 | 0.009 |
|||
| Plot | Lyso | Other | |||||||||||
| Expt C |
22 peptides |
373 spectra |
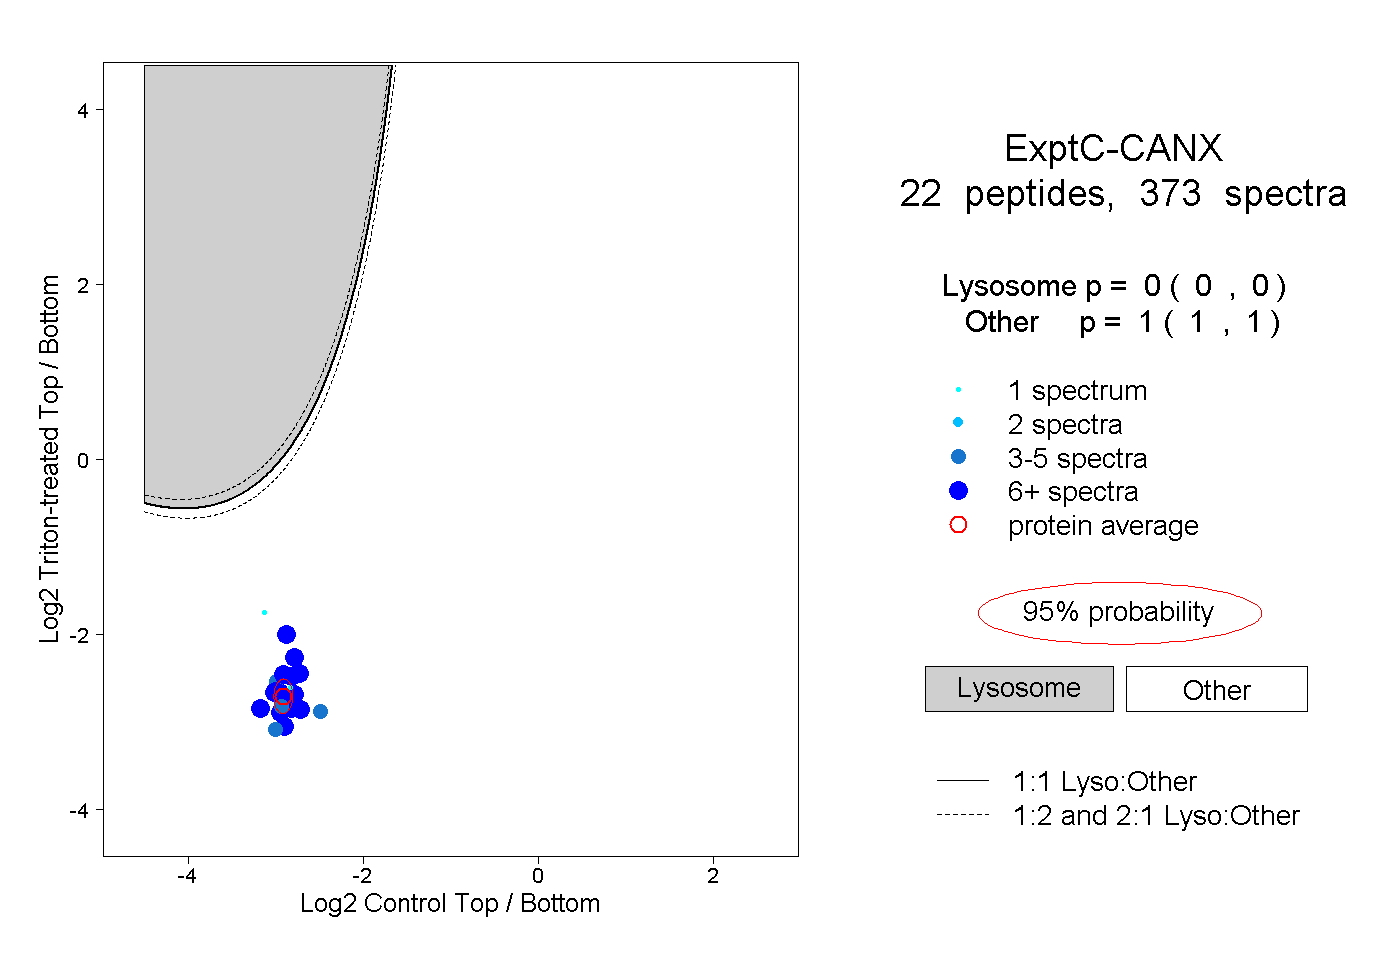 |
0.000 0.000 | 0.000 |
1.000 1.000 | 1.000 |
||||||||
| Plot | Lyso | Other | |||||||||||
| Expt D |
12 peptides |
43 spectra |
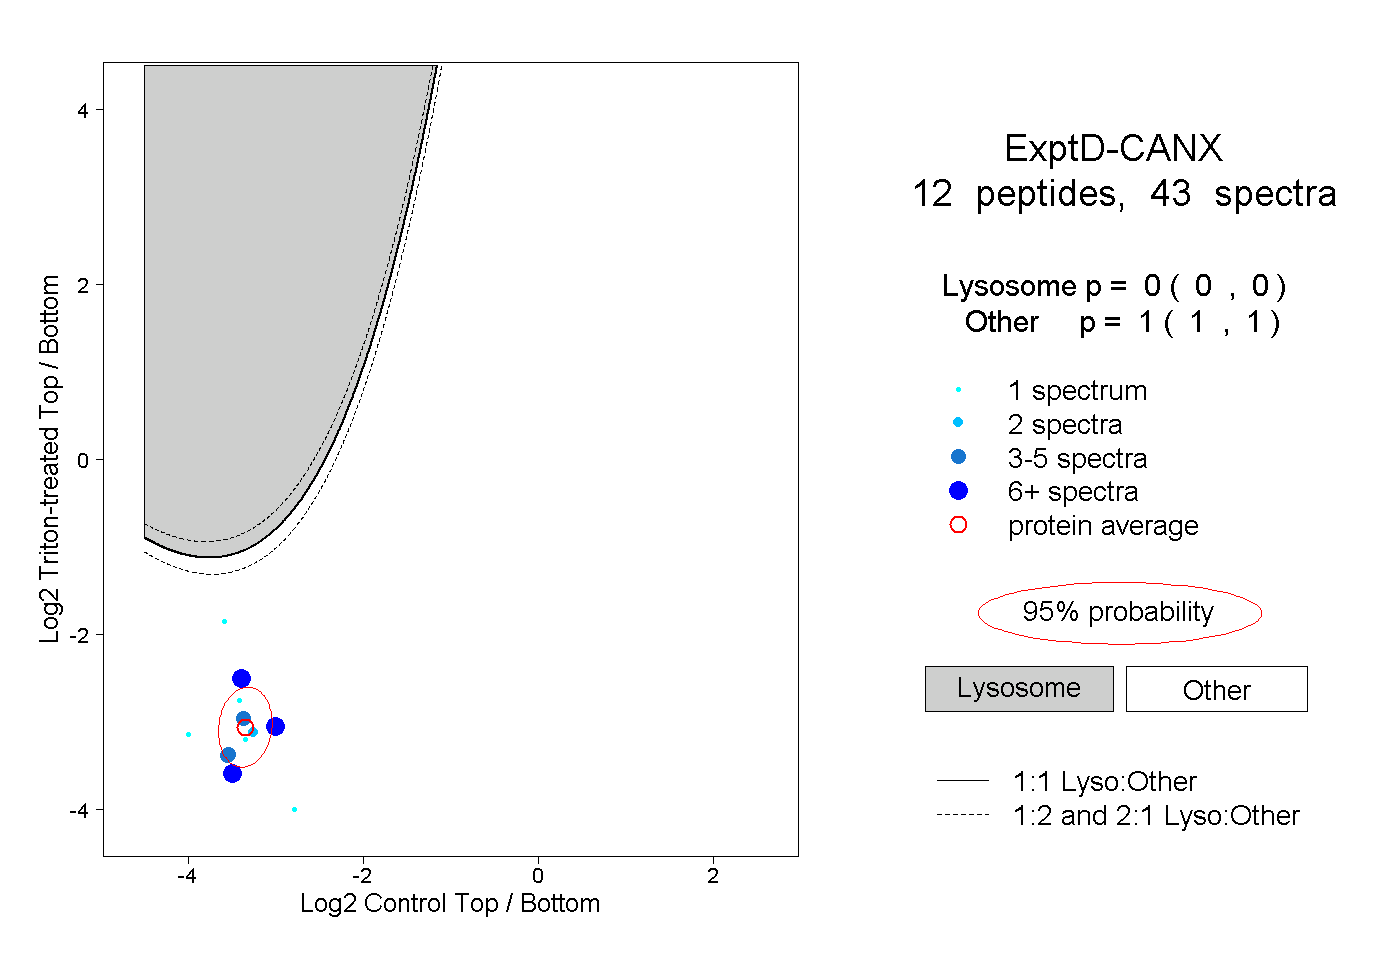 |
0.000 0.000 | 0.000 |
1.000 1.000 | 1.000 |