 2
2peptides
spectra
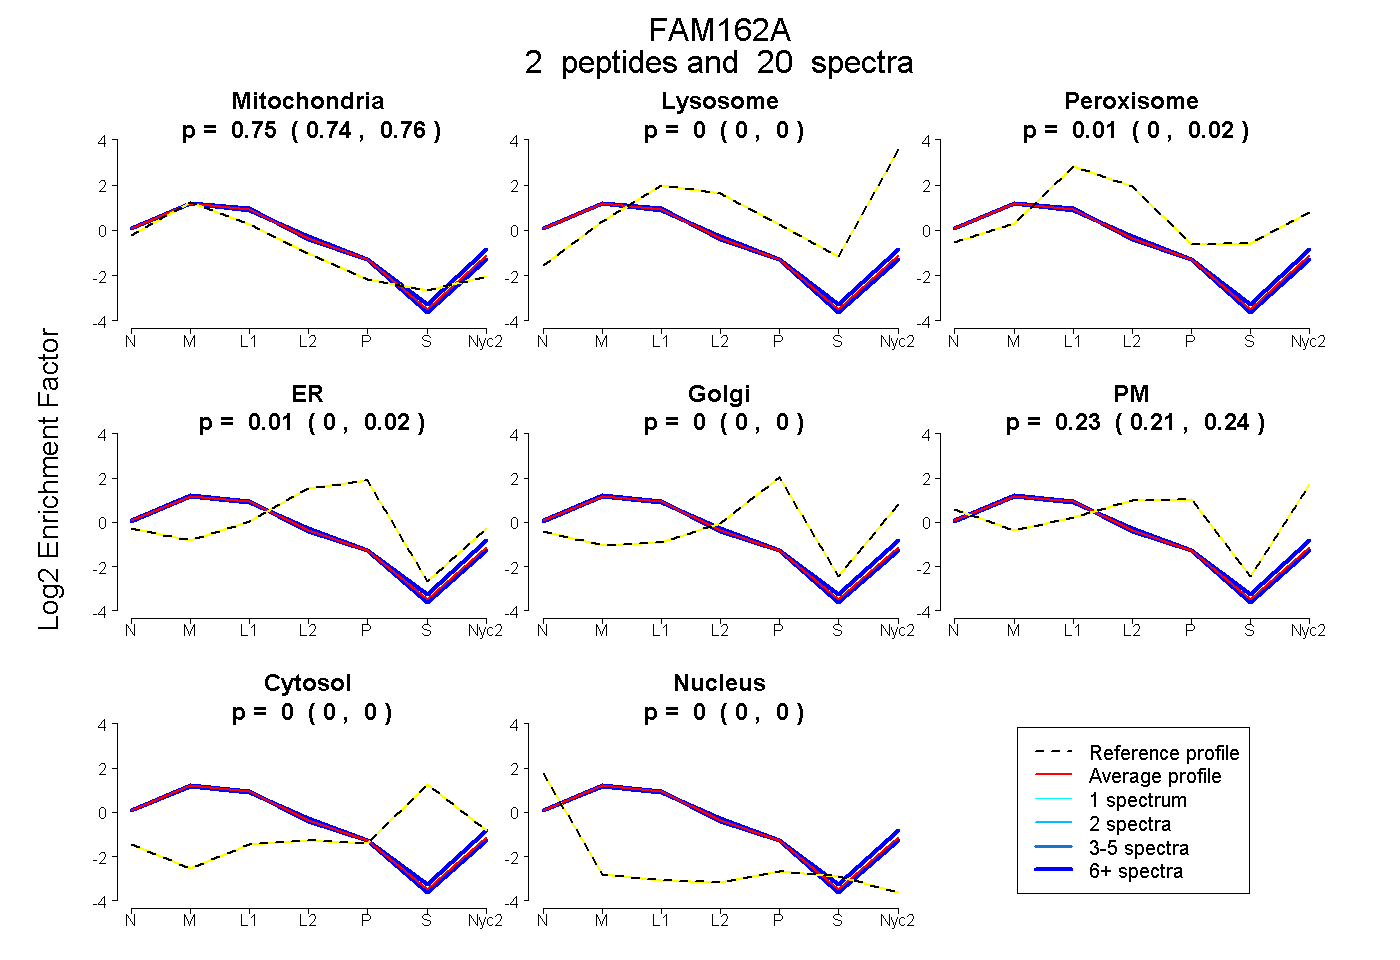
0.743 | 0.757
0.000 | 0.000
0.000 | 0.023
0.000 | 0.019
0.000 | 0.000
0.215 | 0.241
0.000 | 0.000
0.000 | 0.000
2peptides
spectra
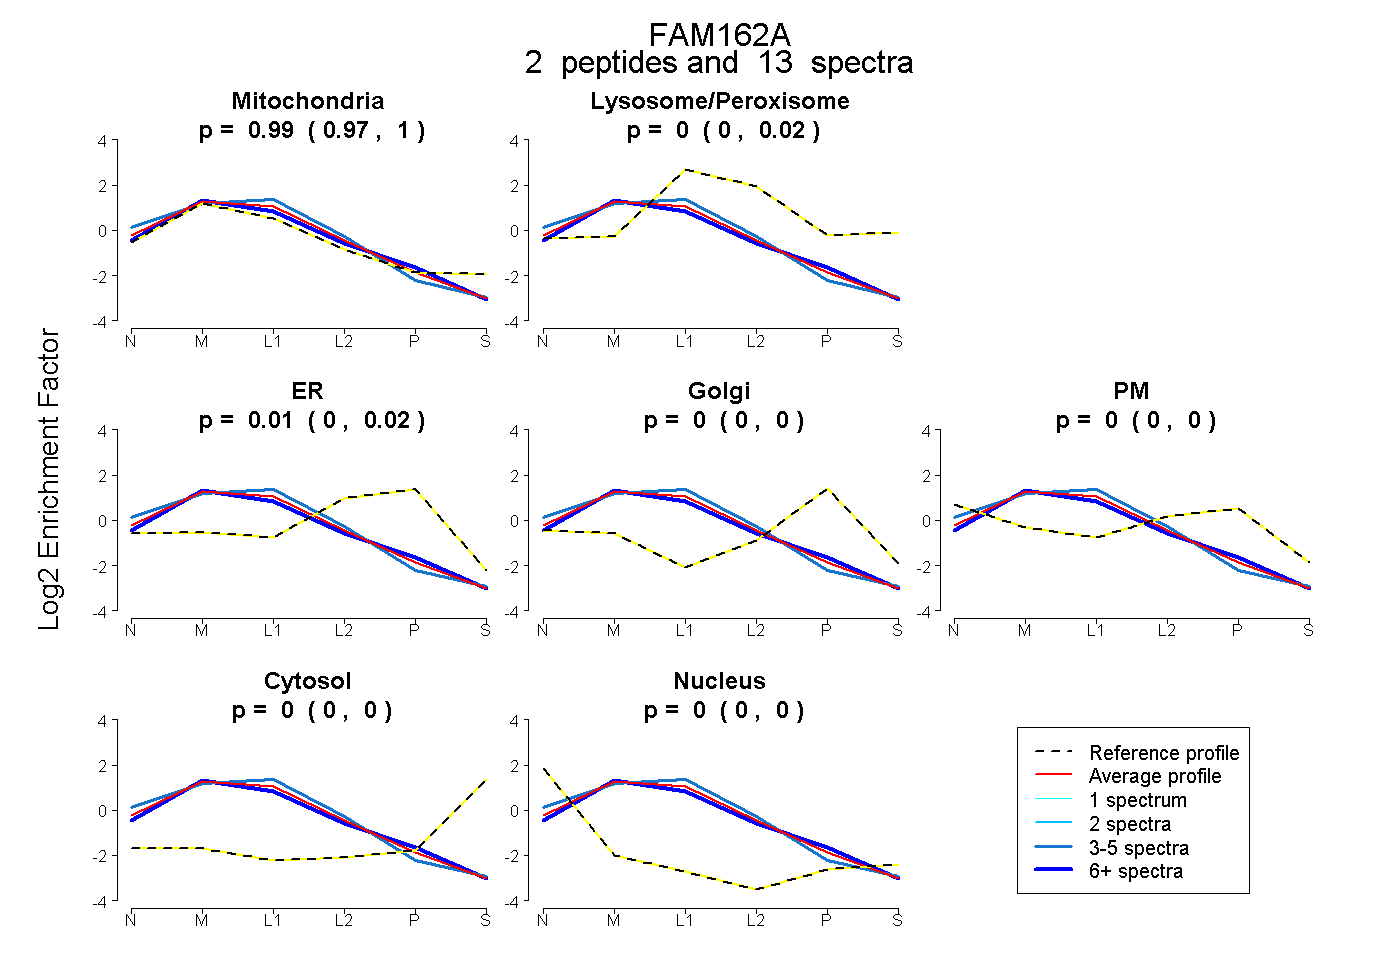
0.973 | 0.997
0.000 | 0.020
0.000 | 0.019
0.000 | 0.000
0.000 | 0.000
0.000 | 0.000
0.000 | 0.000
4peptides
spectra
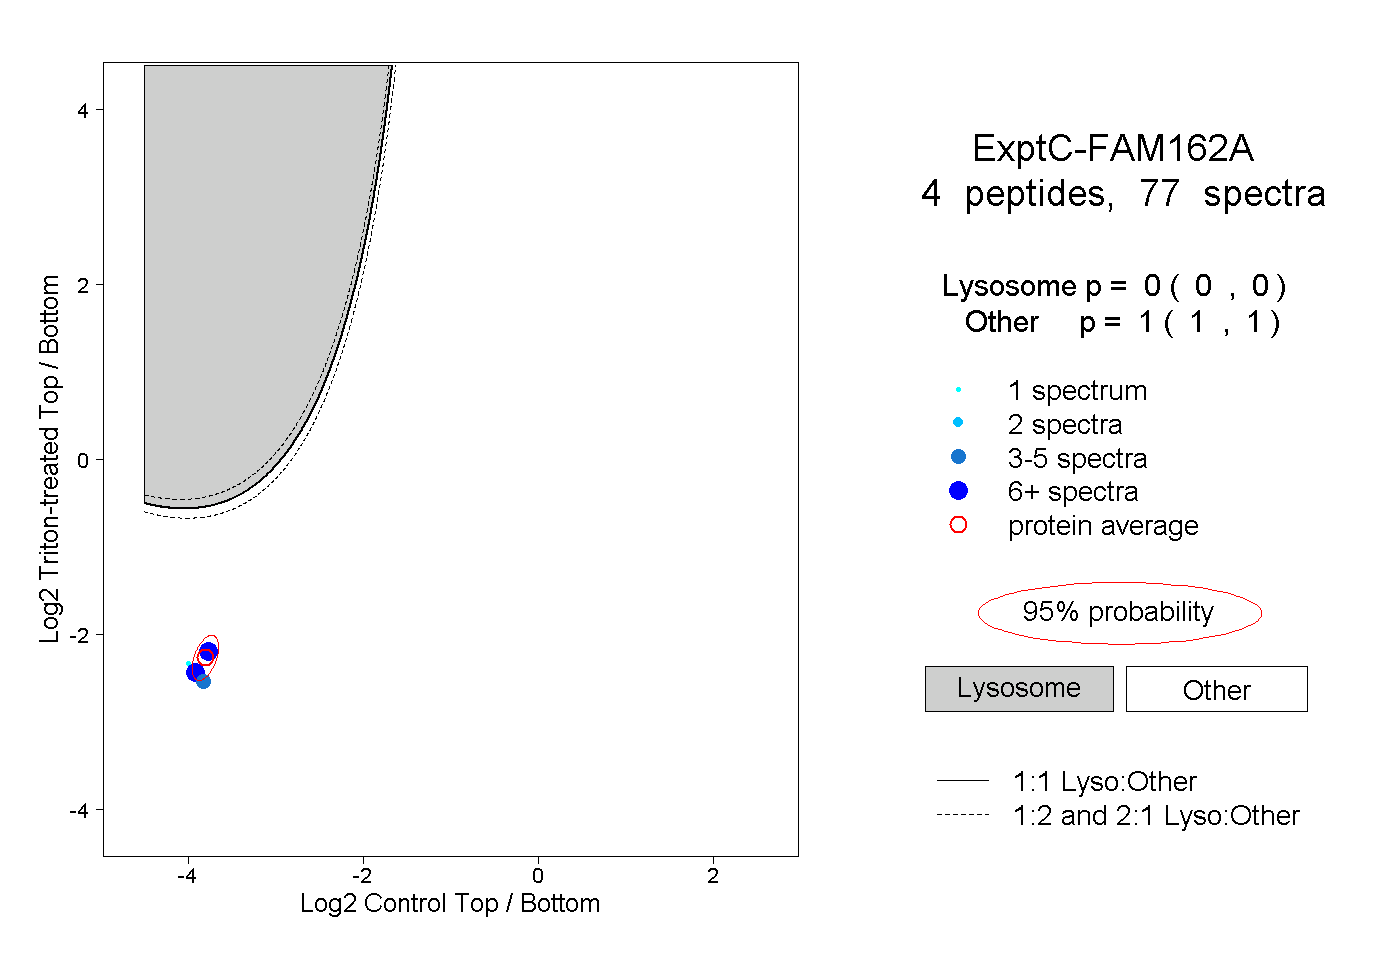
0.000 | 0.000
1.000 | 1.000
1peptide
spectra
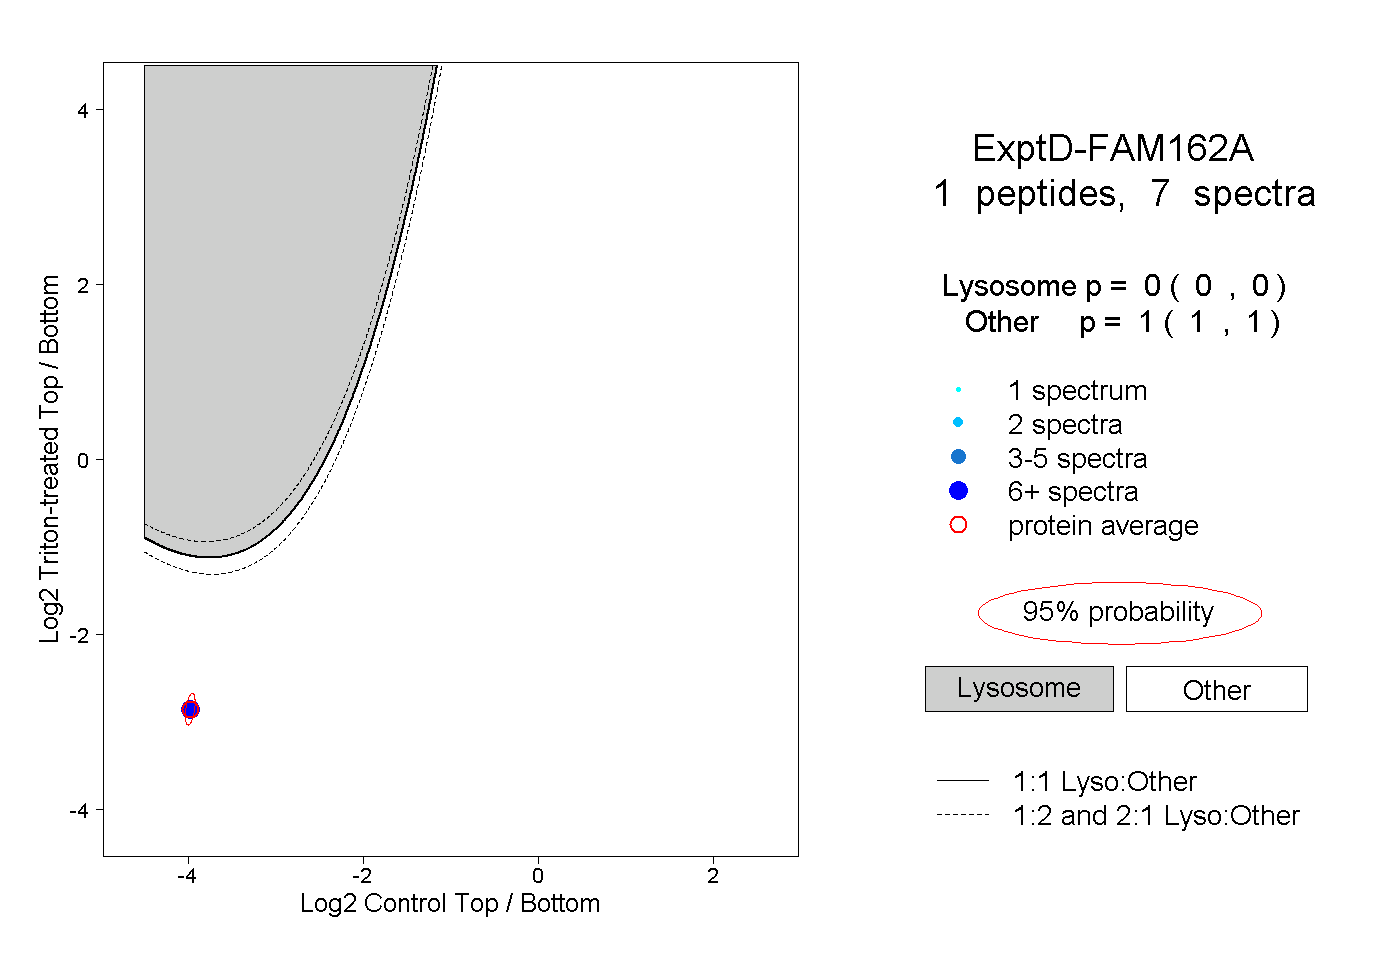
0.000 | 0.000
1.000 | 1.000