 2
2peptides
spectra
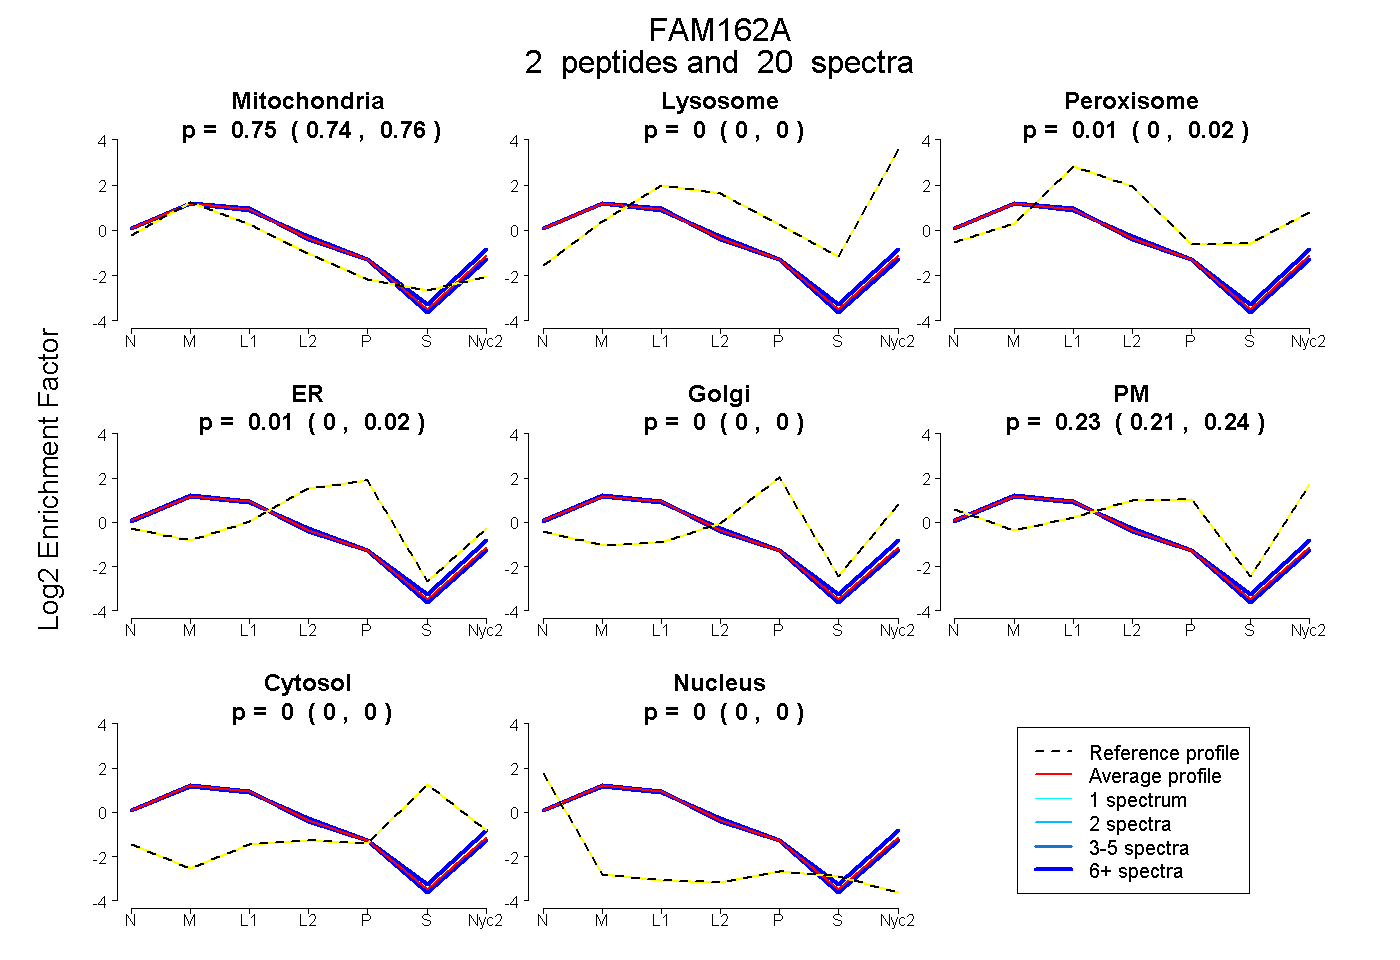
0.743 | 0.757
0.000 | 0.000
0.000 | 0.023
0.000 | 0.019
0.000 | 0.000
0.215 | 0.241
0.000 | 0.000
0.000 | 0.000
| Plot | Mito | Lyso | Perox | ER | Golgi | PM | Cytosol | Nucleus | |||||
| Expt A |
2 peptides |
20 spectra |
|
0.750 0.743 | 0.757 |
0.000 0.000 | 0.000 |
0.012 0.000 | 0.023 |
0.007 0.000 | 0.019 |
0.000 0.000 | 0.000 |
0.230 0.215 | 0.241 |
0.000 0.000 | 0.000 |
0.000 0.000 | 0.000 |
| 13 spectra, APTQSYR | 0.773 | 0.000 | 0.000 | 0.043 | 0.000 | 0.184 | 0.000 | 0.000 | ||
| 7 spectra, ILLWSGR | 0.710 | 0.038 | 0.018 | 0.000 | 0.000 | 0.235 | 0.000 | 0.000 |
| Plot | Mito | Lyso or Perox | ER | Golgi | PM | Cytosol | Nucleus | ||||||
| Expt B |
2 peptides |
13 spectra |
 |
0.989 0.973 | 0.997 |
0.003 0.000 | 0.020 |
0.008 0.000 | 0.019 |
0.000 0.000 | 0.000 |
0.000 0.000 | 0.000 |
0.000 0.000 | 0.000 |
0.000 0.000 | 0.000 |
|||
| Plot | Lyso | Other | |||||||||||
| Expt C |
4 peptides |
77 spectra |
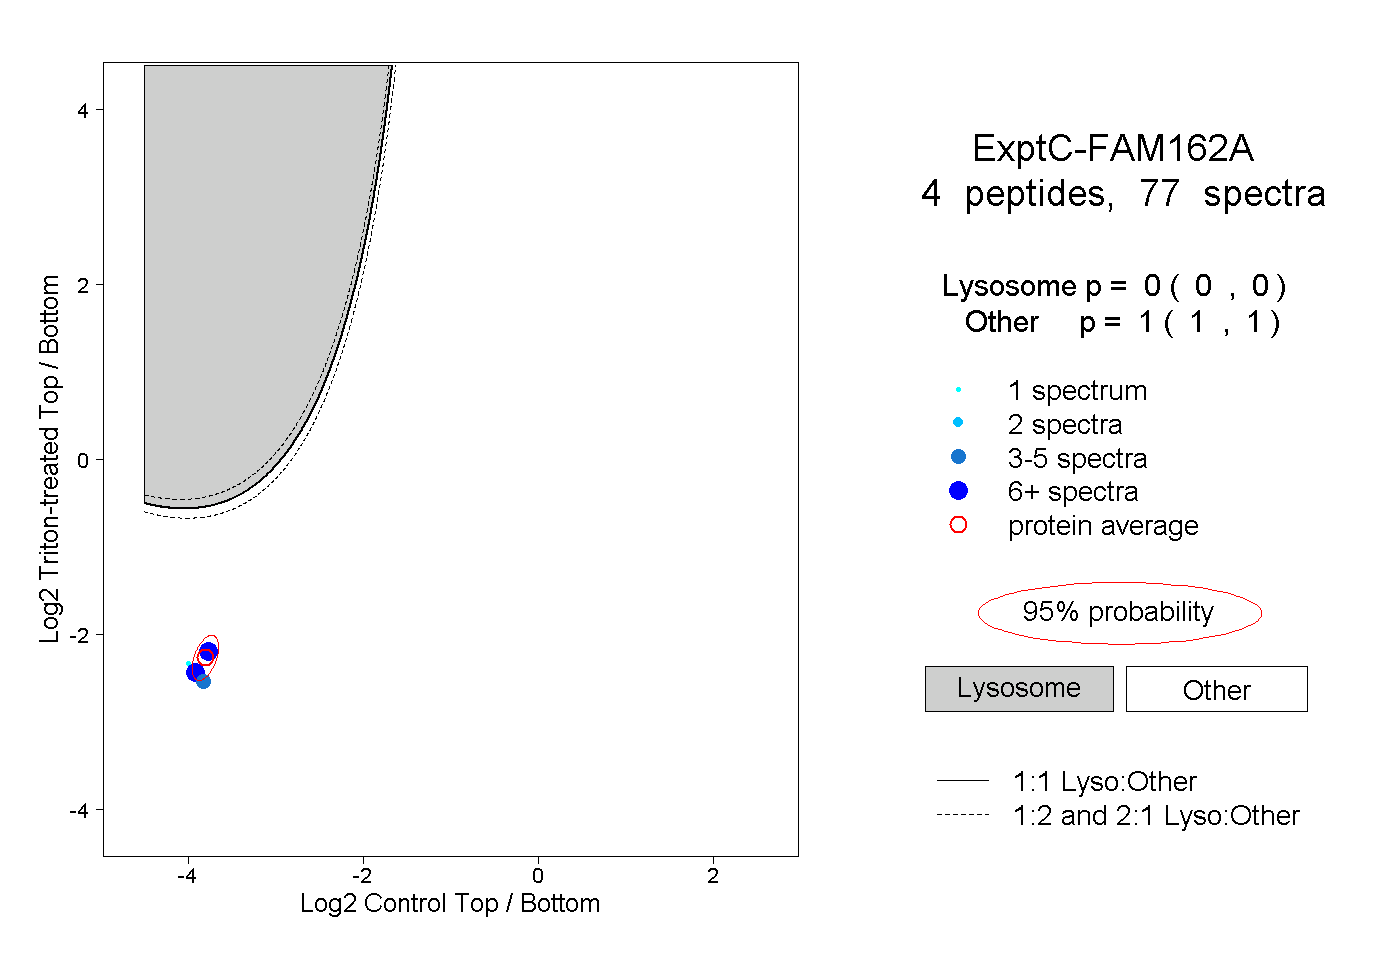 |
0.000 0.000 | 0.000 |
1.000 1.000 | 1.000 |
||||||||
| Plot | Lyso | Other | |||||||||||
| Expt D |
1 peptide |
7 spectra |
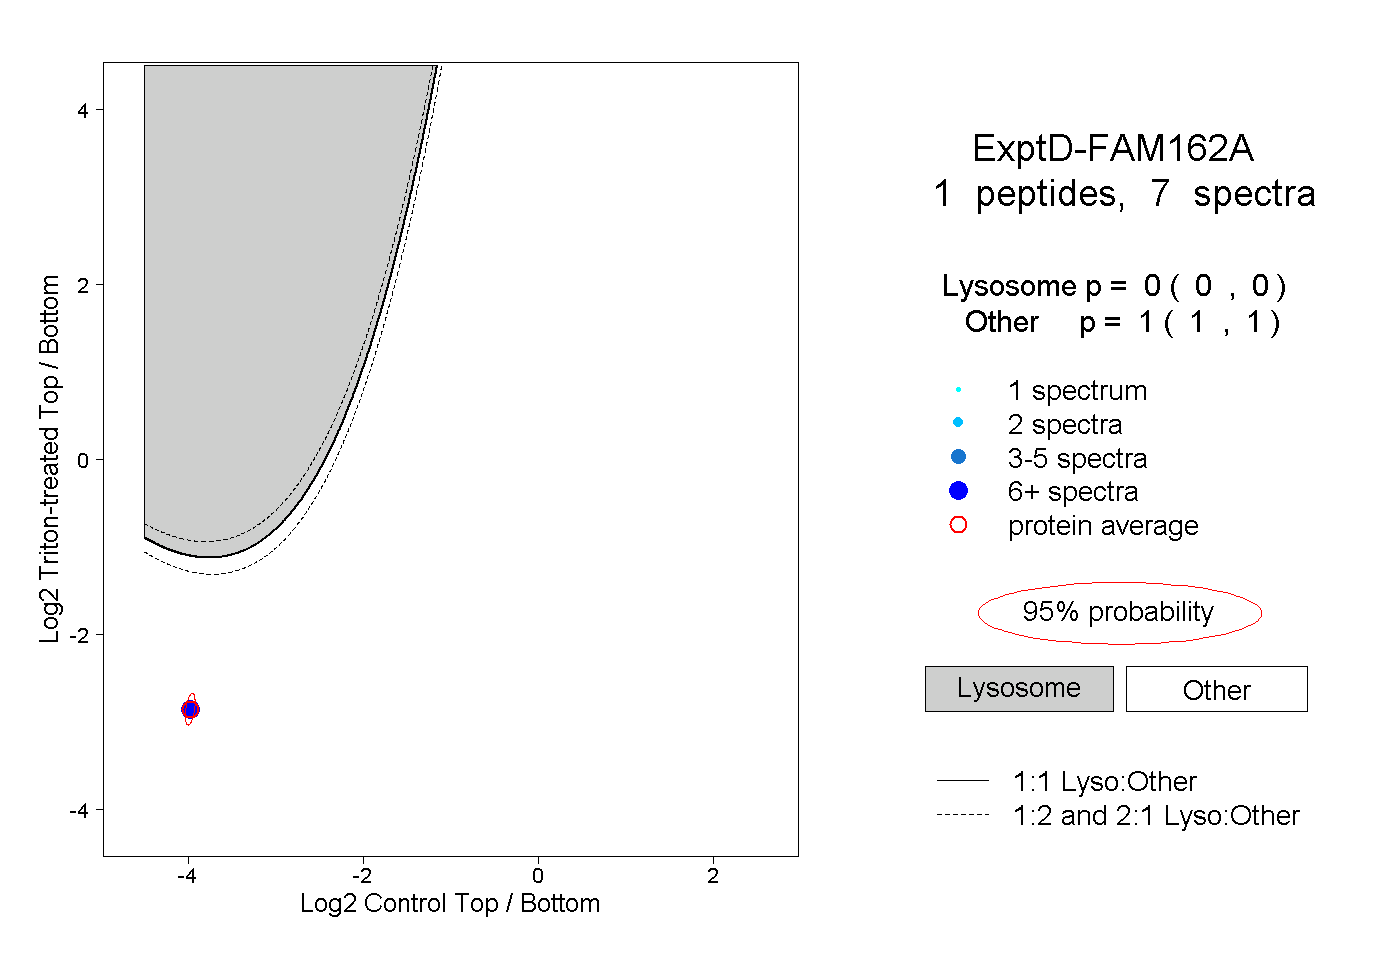 |
0.000 0.000 | 0.000 |
1.000 1.000 | 1.000 |