 5
5peptides
spectra
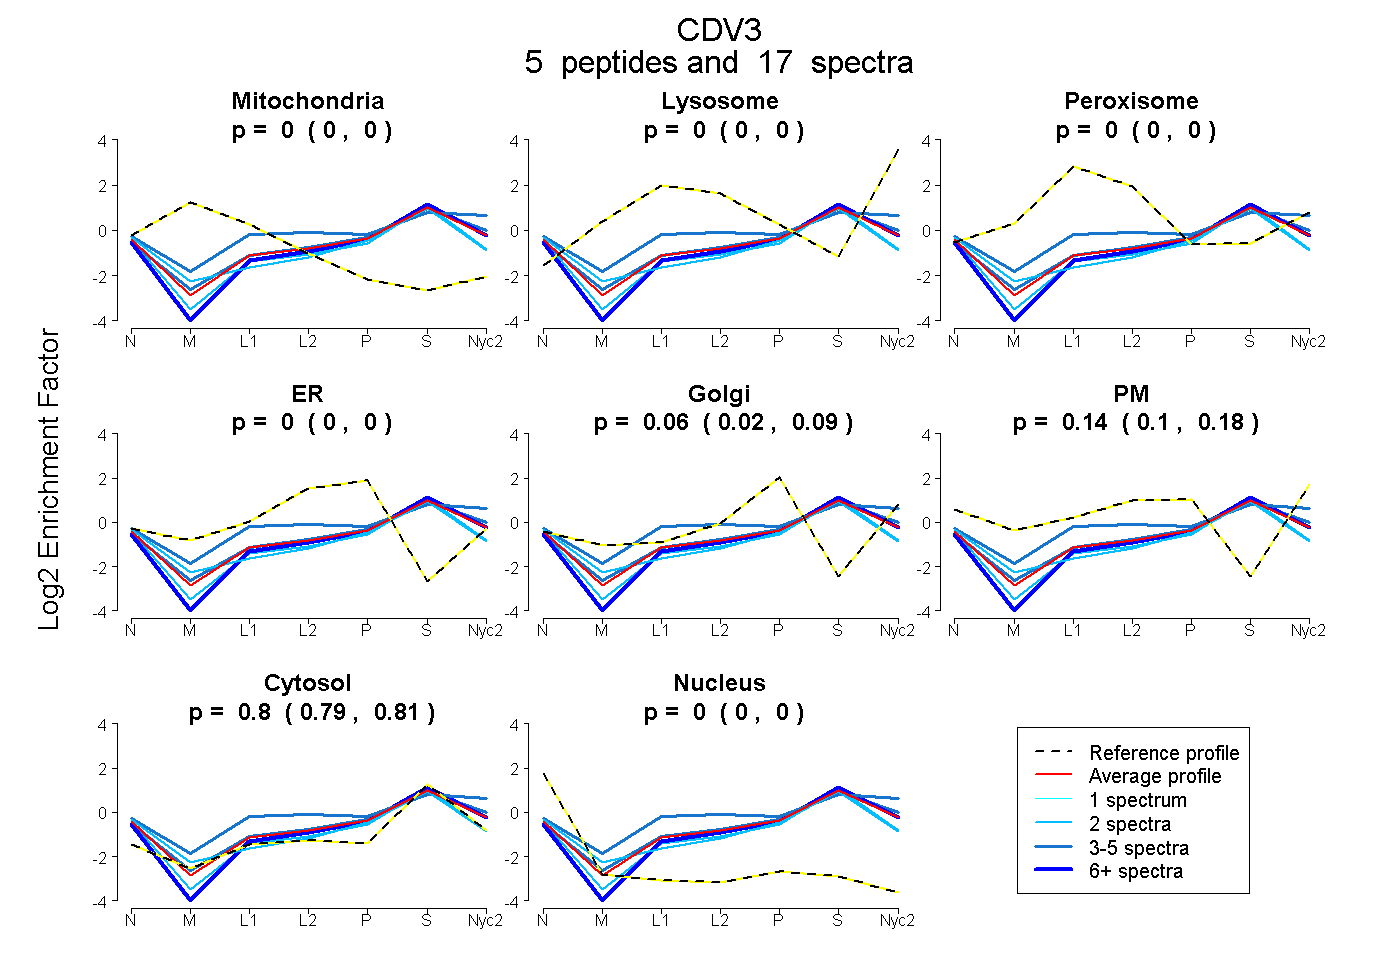
0.000 | 0.000
0.000 | 0.000
0.000 | 0.000
0.000 | 0.000
0.020 | 0.085
0.099 | 0.175
0.793 | 0.813
0.000 | 0.000
2peptides
spectra
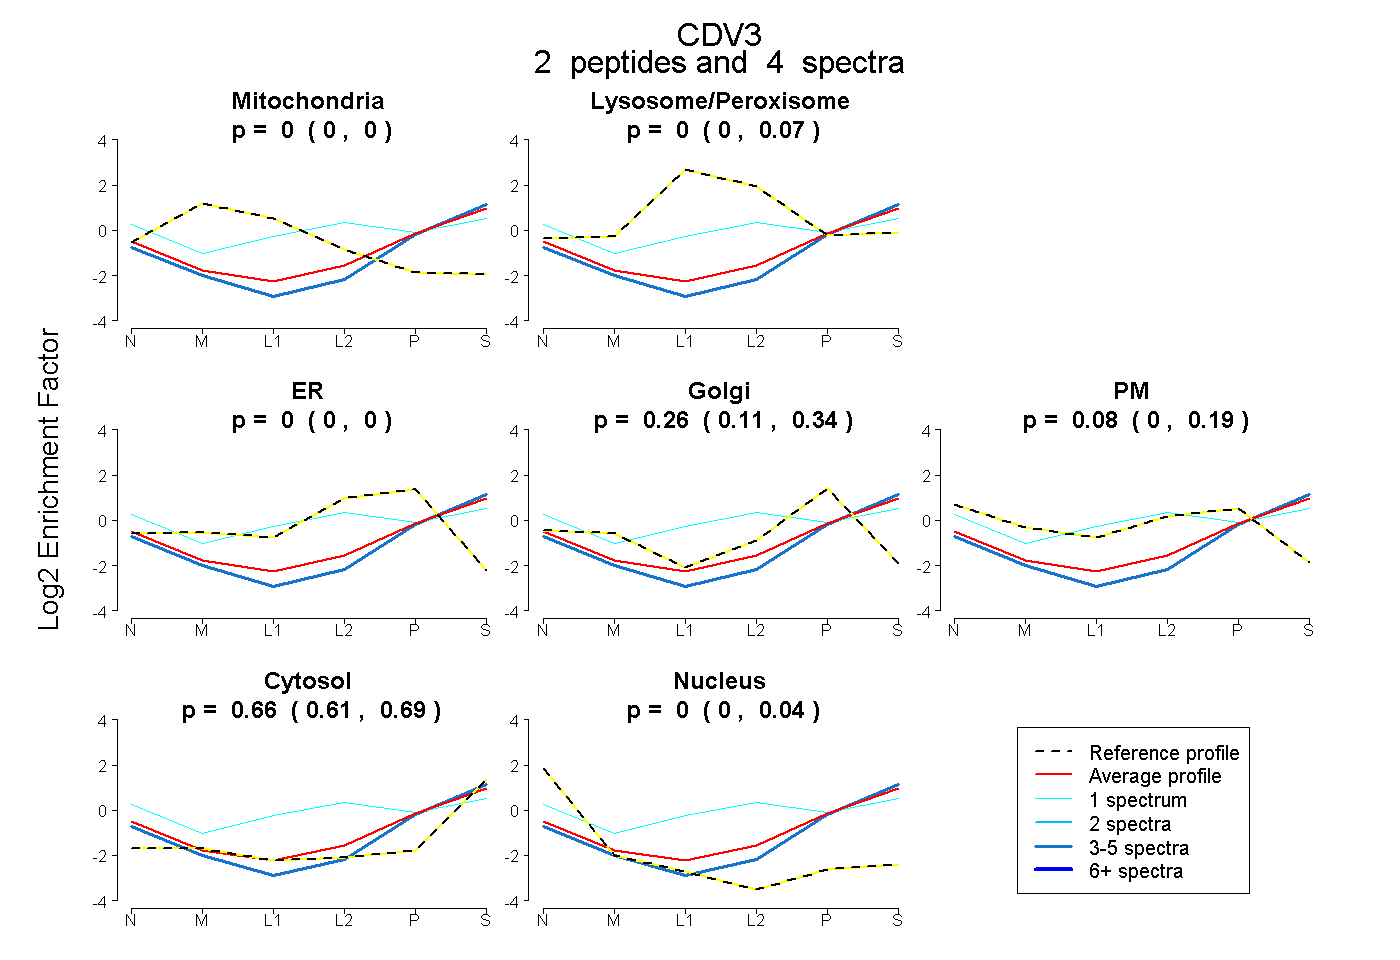
0.000 | 0.000
0.000 | 0.073
0.000 | 0.000
0.115 | 0.335
0.000 | 0.187
0.615 | 0.690
0.000 | 0.038
5peptides
spectra
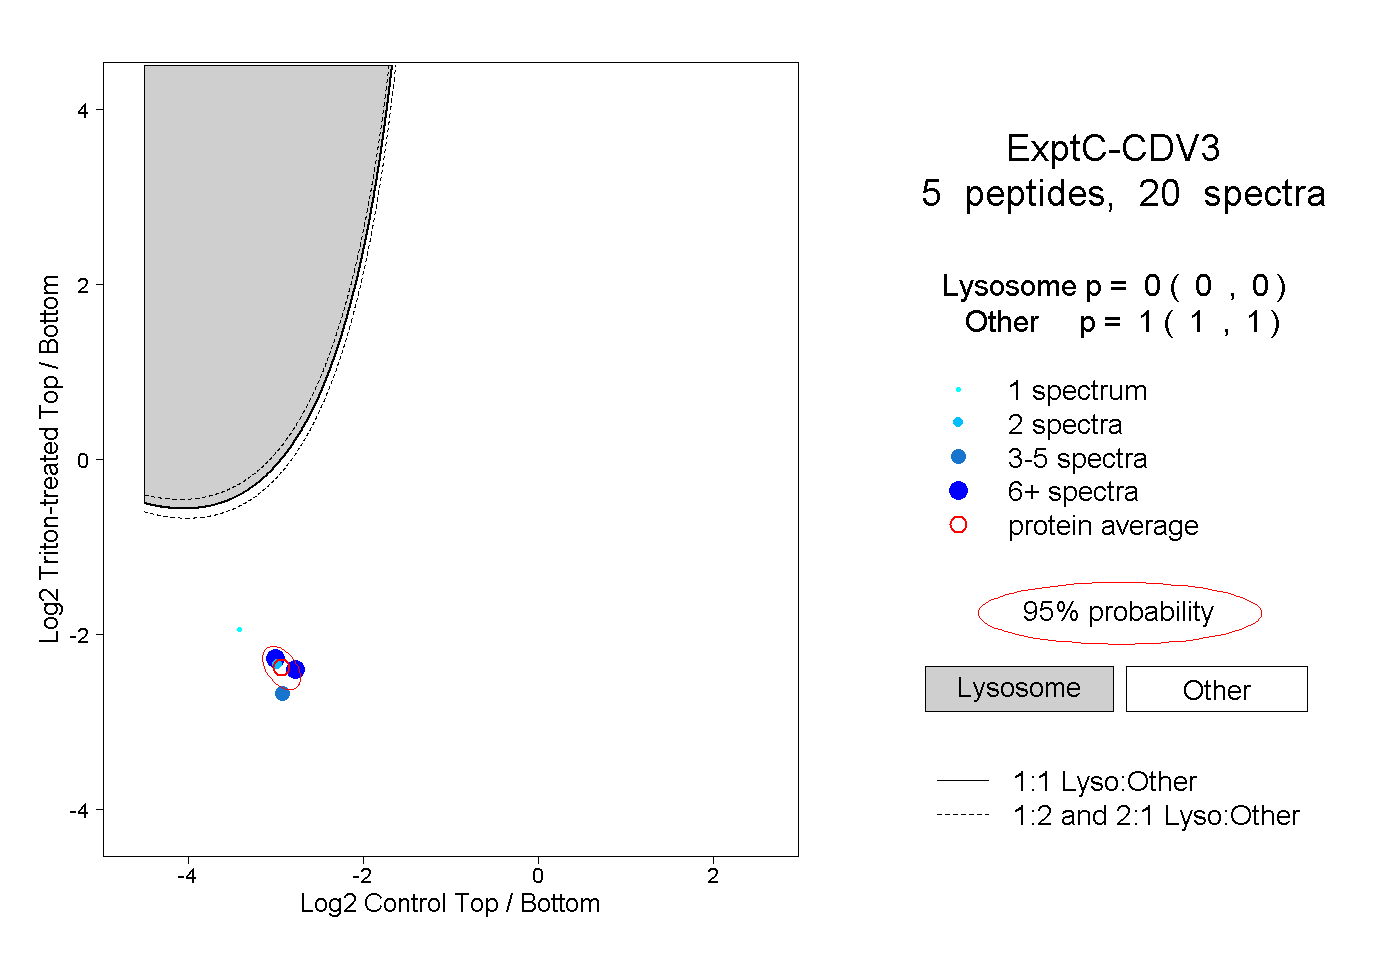
0.000 | 0.000
1.000 | 1.000
1peptide
spectra
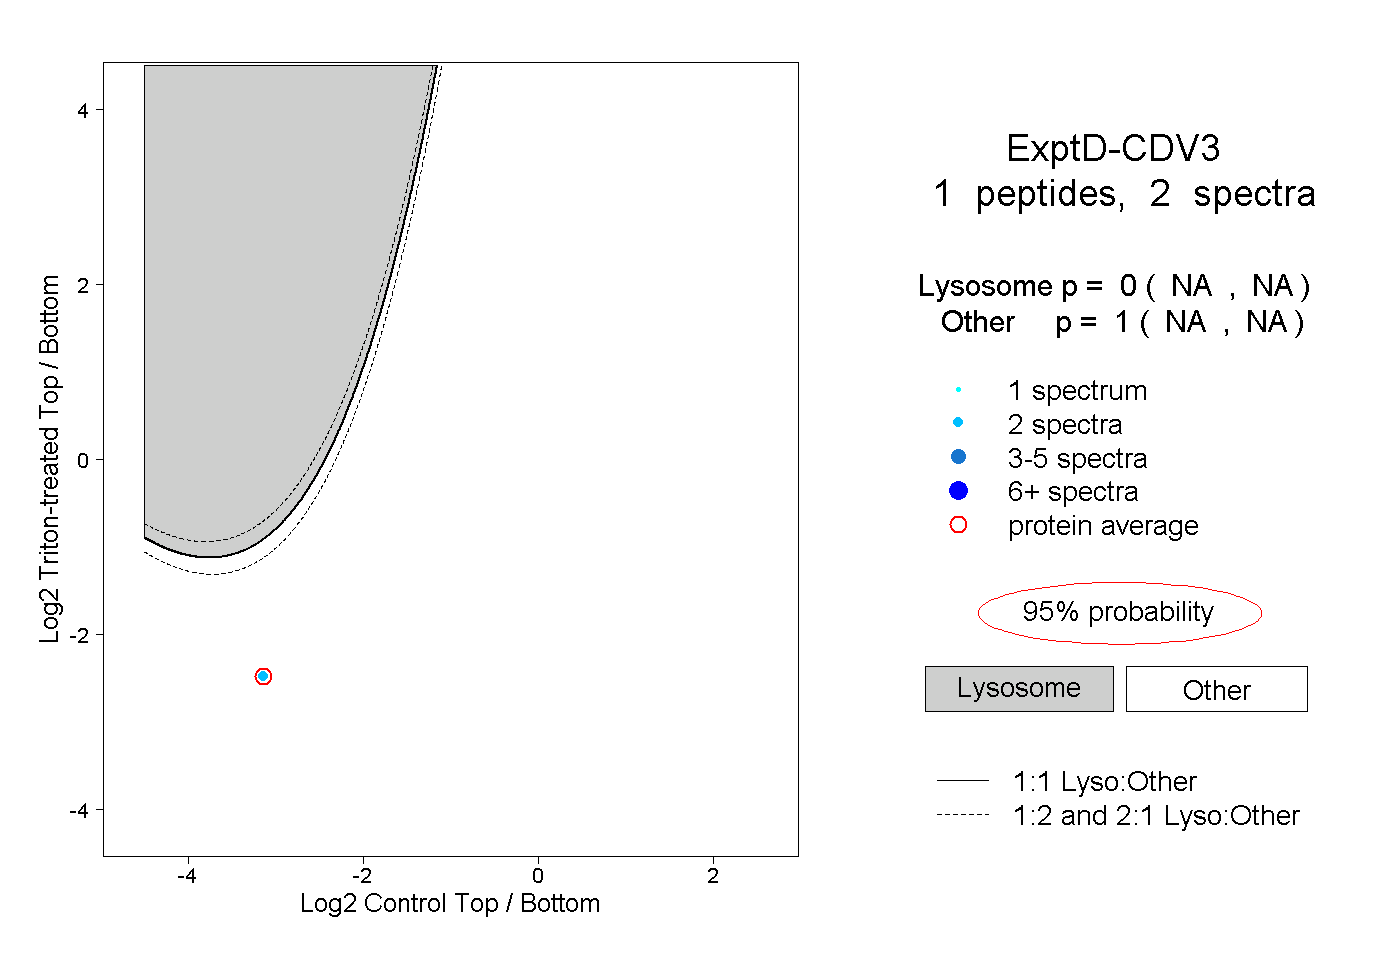
NA | NA
NA | NA