 5
5peptides
spectra
0.000 | 0.000
0.000 | 0.000
0.000 | 0.000
0.000 | 0.000
0.020 | 0.085
0.099 | 0.175
0.793 | 0.813
0.000 | 0.000
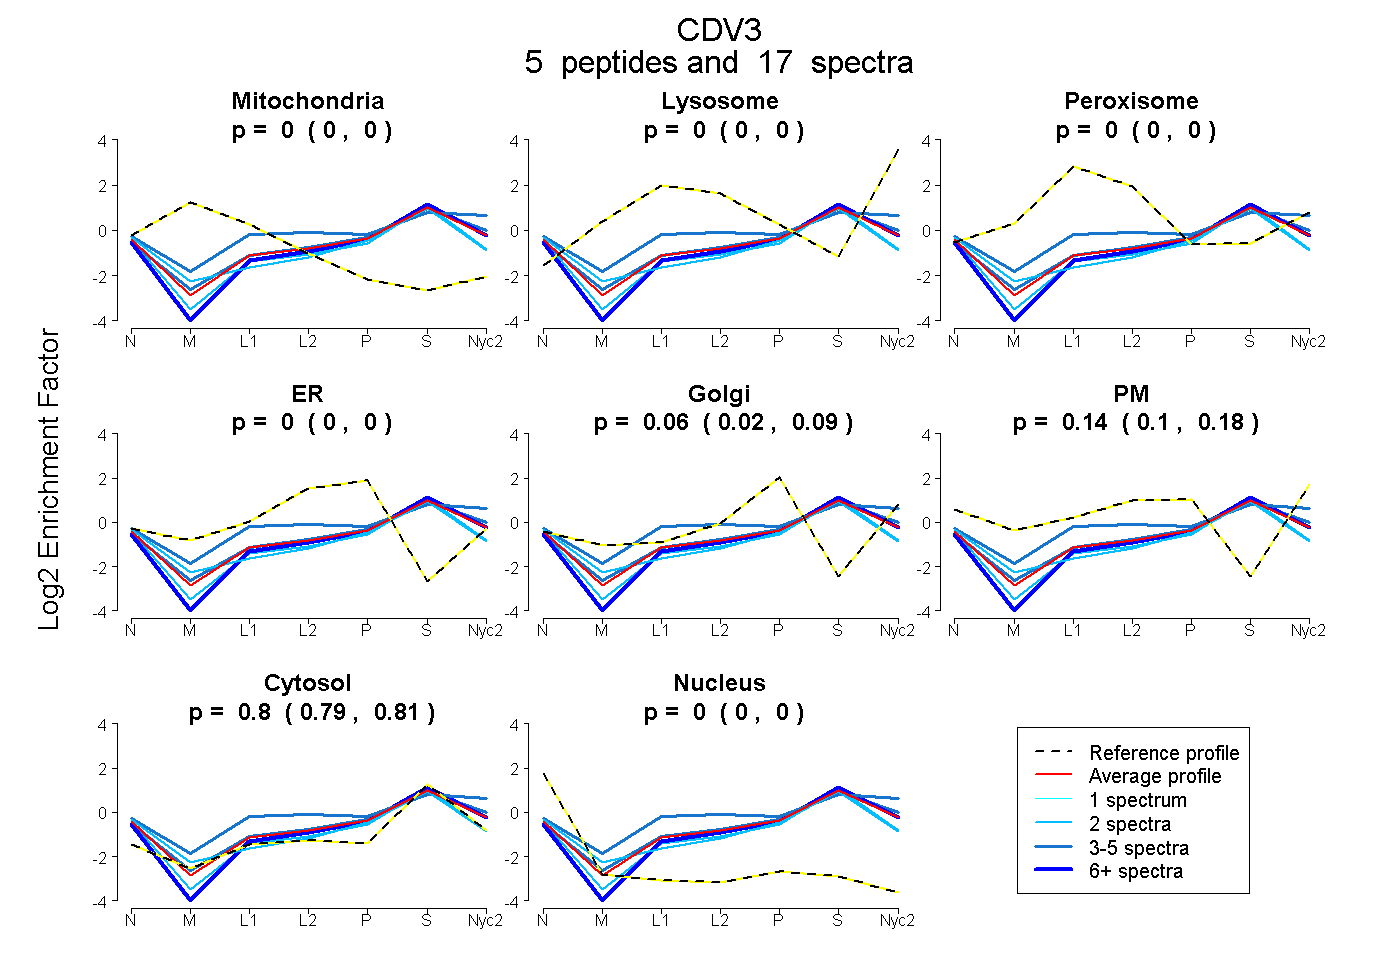
| Plot | Mito | Lyso | Perox | ER | Golgi | PM | Cytosol | Nucleus | |||||
| Expt A |
5 peptides |
17 spectra |
|
0.000 0.000 | 0.000 |
0.000 0.000 | 0.000 |
0.000 0.000 | 0.000 |
0.000 0.000 | 0.000 |
0.056 0.020 | 0.085 |
0.140 0.099 | 0.175 |
0.805 0.793 | 0.813 |
0.000 0.000 | 0.000 |
| 2 spectra, EVDYSGLR | 0.000 | 0.000 | 0.000 | 0.015 | 0.075 | 0.000 | 0.862 | 0.049 | ||
| 3 spectra, SGDGGSAGPGGK | 0.000 | 0.000 | 0.000 | 0.000 | 0.050 | 0.173 | 0.777 | 0.000 | ||
| 6 spectra, SGDGGSLGSGAR | 0.000 | 0.000 | 0.000 | 0.000 | 0.121 | 0.000 | 0.879 | 0.000 | ||
| 4 spectra, SLDNFFAK | 0.000 | 0.100 | 0.089 | 0.000 | 0.000 | 0.222 | 0.588 | 0.000 | ||
| 2 spectra, SSGPWNK | 0.000 | 0.000 | 0.000 | 0.000 | 0.162 | 0.000 | 0.772 | 0.066 |
| Plot | Mito | Lyso or Perox | ER | Golgi | PM | Cytosol | Nucleus | ||||||
| Expt B |
2 peptides |
4 spectra |
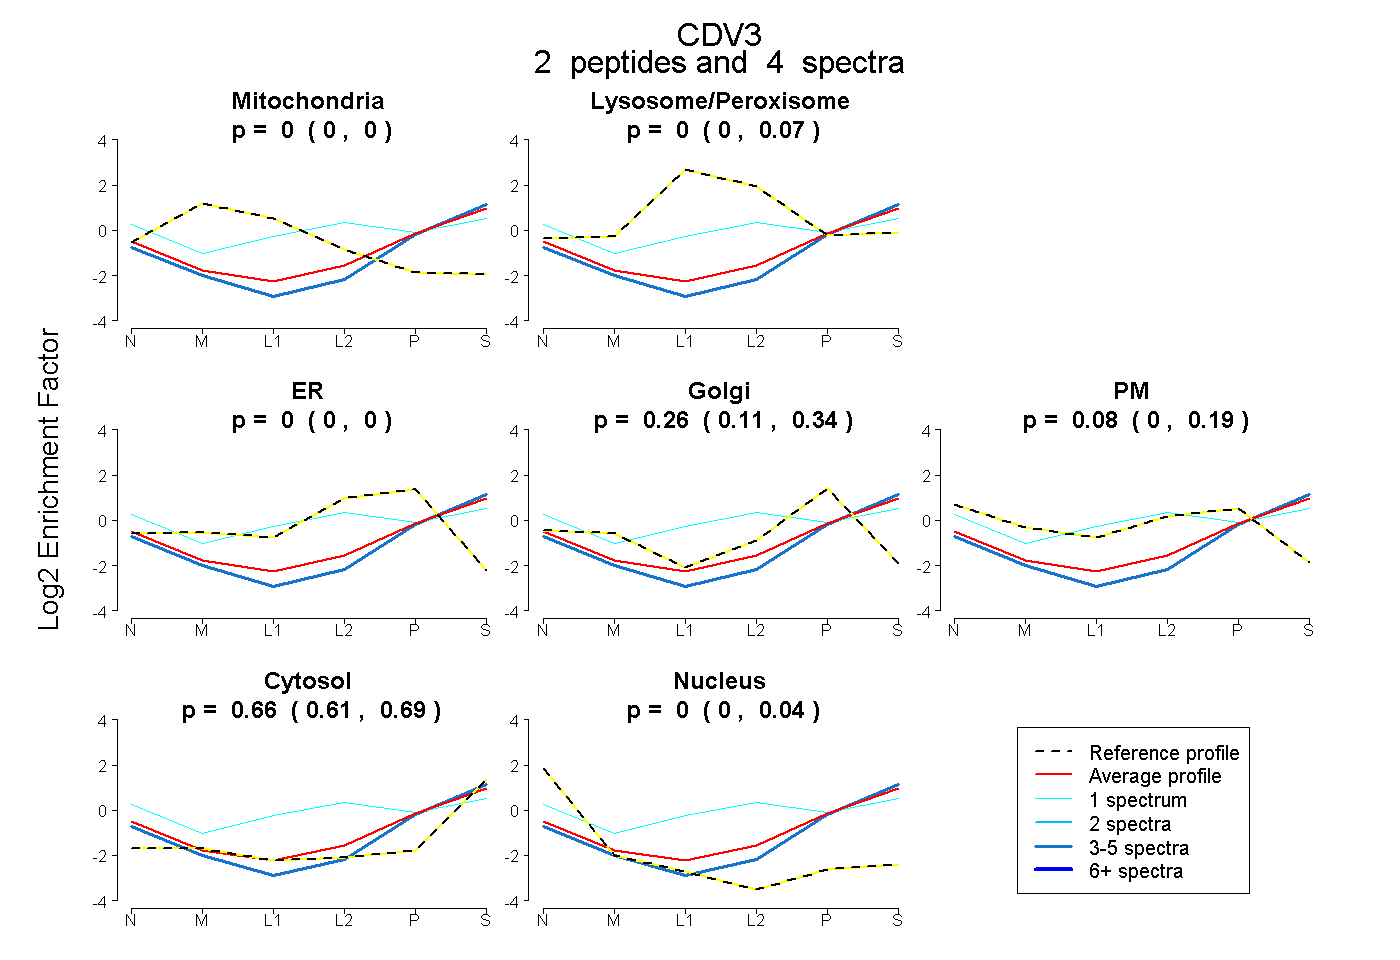 |
0.000 0.000 | 0.000 |
0.000 0.000 | 0.073 |
0.000 0.000 | 0.000 |
0.261 0.115 | 0.335 |
0.077 0.000 | 0.187 |
0.662 0.615 | 0.690 |
0.000 0.000 | 0.038 |
|||
| Plot | Lyso | Other | |||||||||||
| Expt C |
5 peptides |
20 spectra |
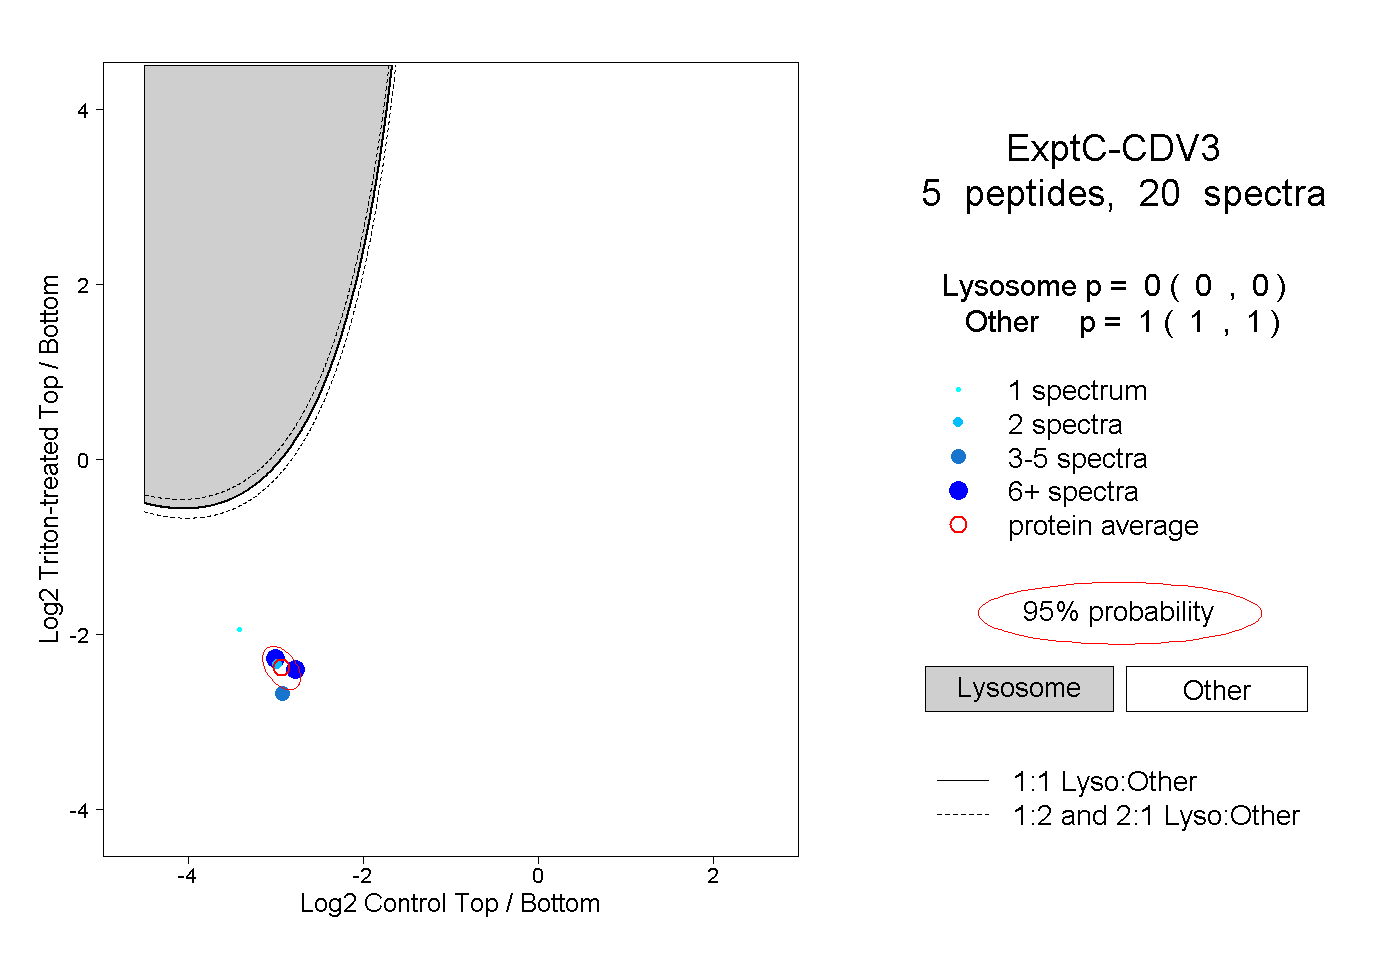 |
0.000 0.000 | 0.000 |
1.000 1.000 | 1.000 |
||||||||
| Plot | Lyso | Other | |||||||||||
| Expt D |
1 peptide |
2 spectra |
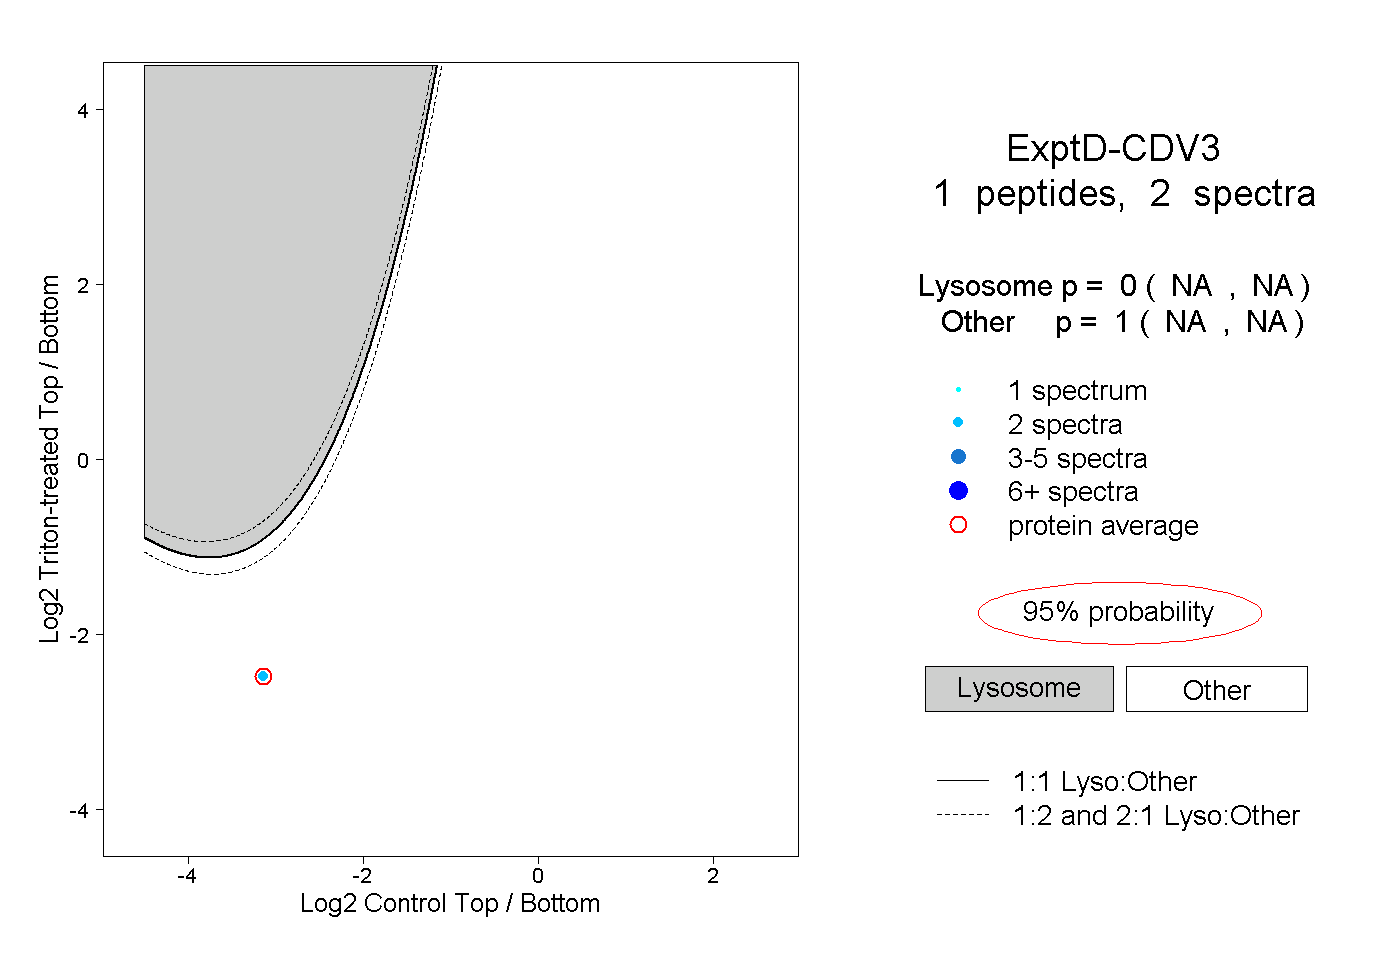 |
0.000 NA | NA |
1.000 NA | NA |