 4
4peptides
spectra
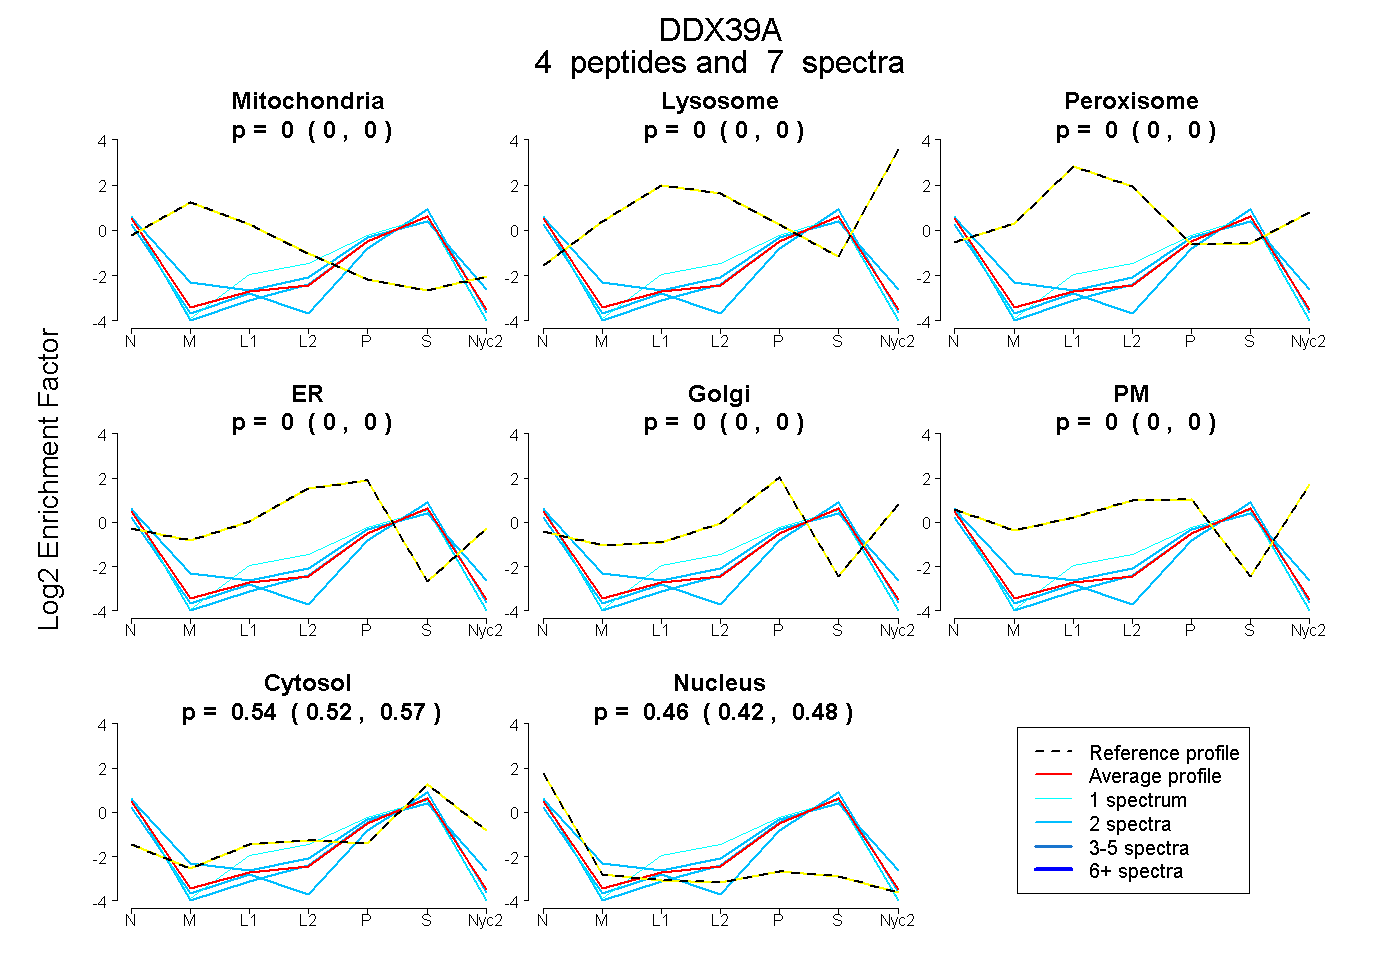
0.000 | 0.000
0.000 | 0.000
0.000 | 0.000
0.000 | 0.000
0.000 | 0.000
0.000 | 0.000
0.517 | 0.570
0.425 | 0.478
3peptides
spectra
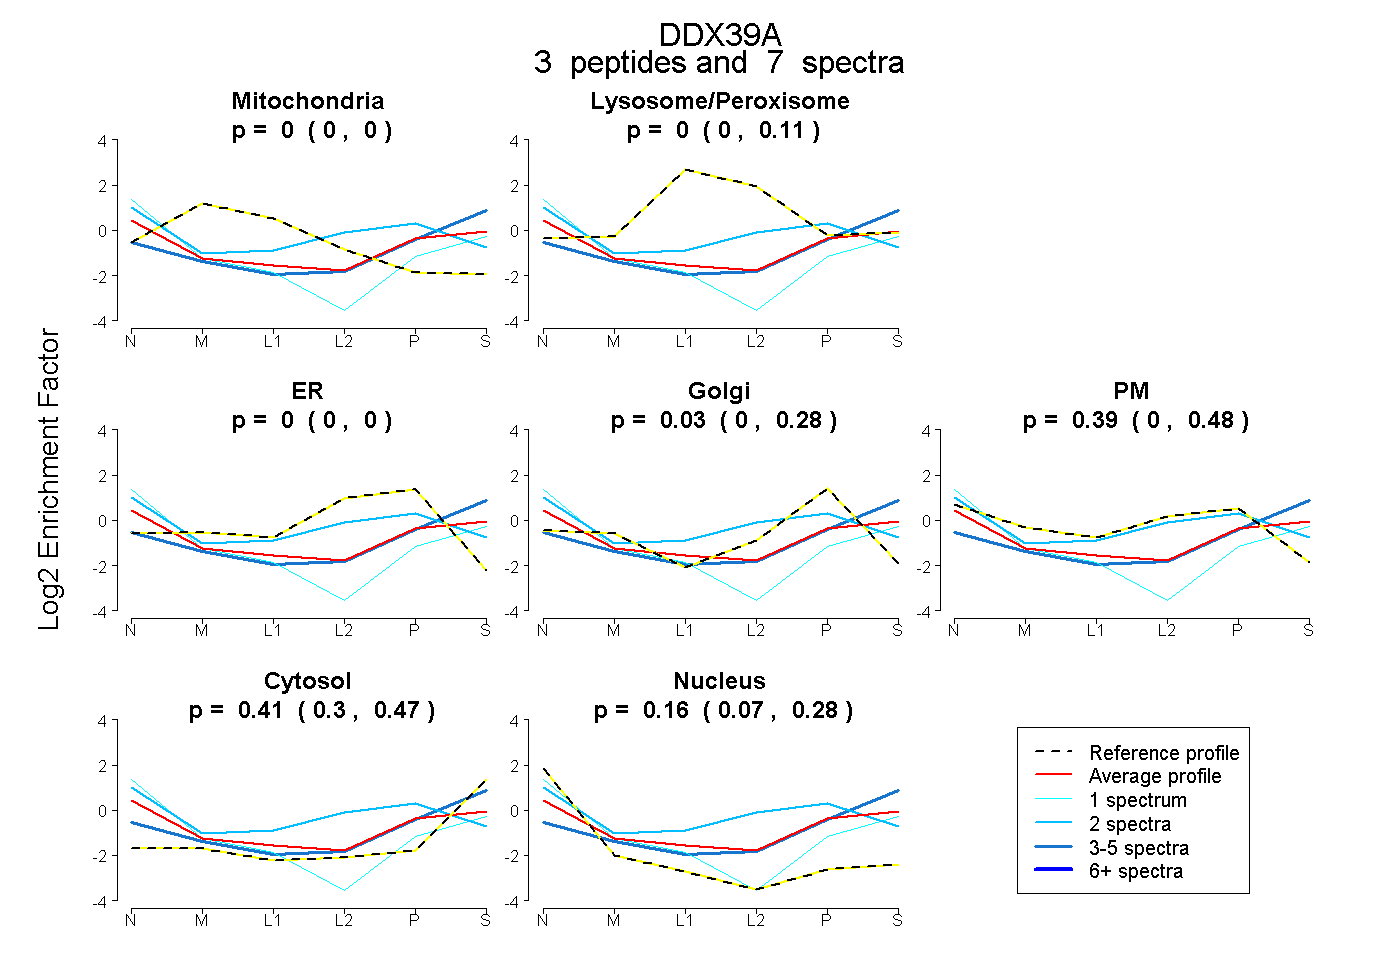
0.000 | 0.000
0.000 | 0.109
0.000 | 0.000
0.000 | 0.284
0.000 | 0.483
0.298 | 0.472
0.072 | 0.279
1peptide
spectrum
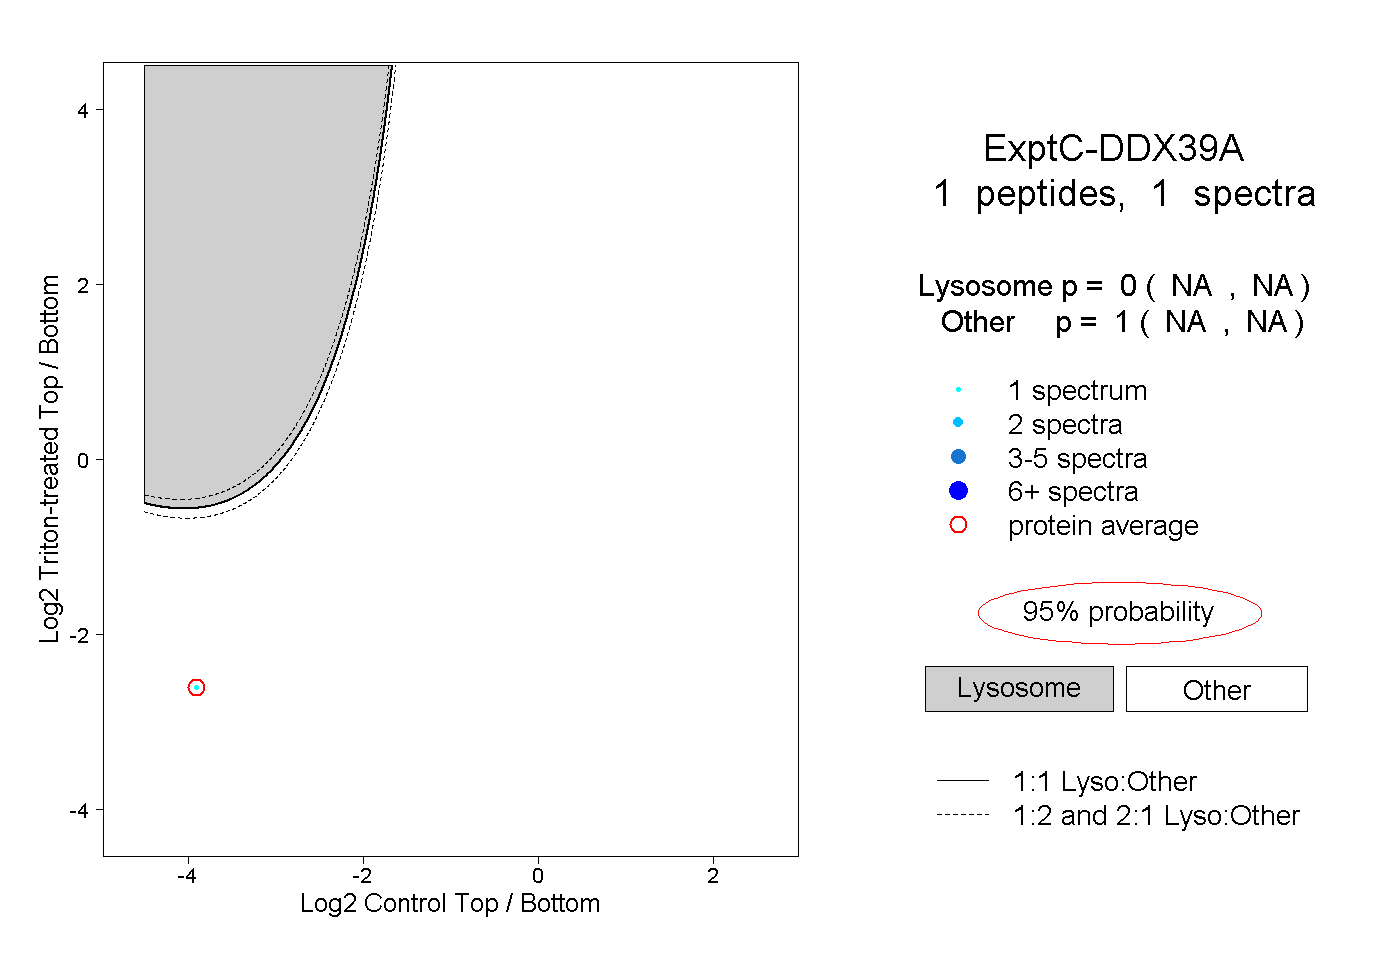
NA | NA
NA | NA