 4
4peptides
spectra
0.000 | 0.000
0.000 | 0.000
0.000 | 0.000
0.000 | 0.000
0.000 | 0.000
0.000 | 0.000
0.517 | 0.570
0.425 | 0.478
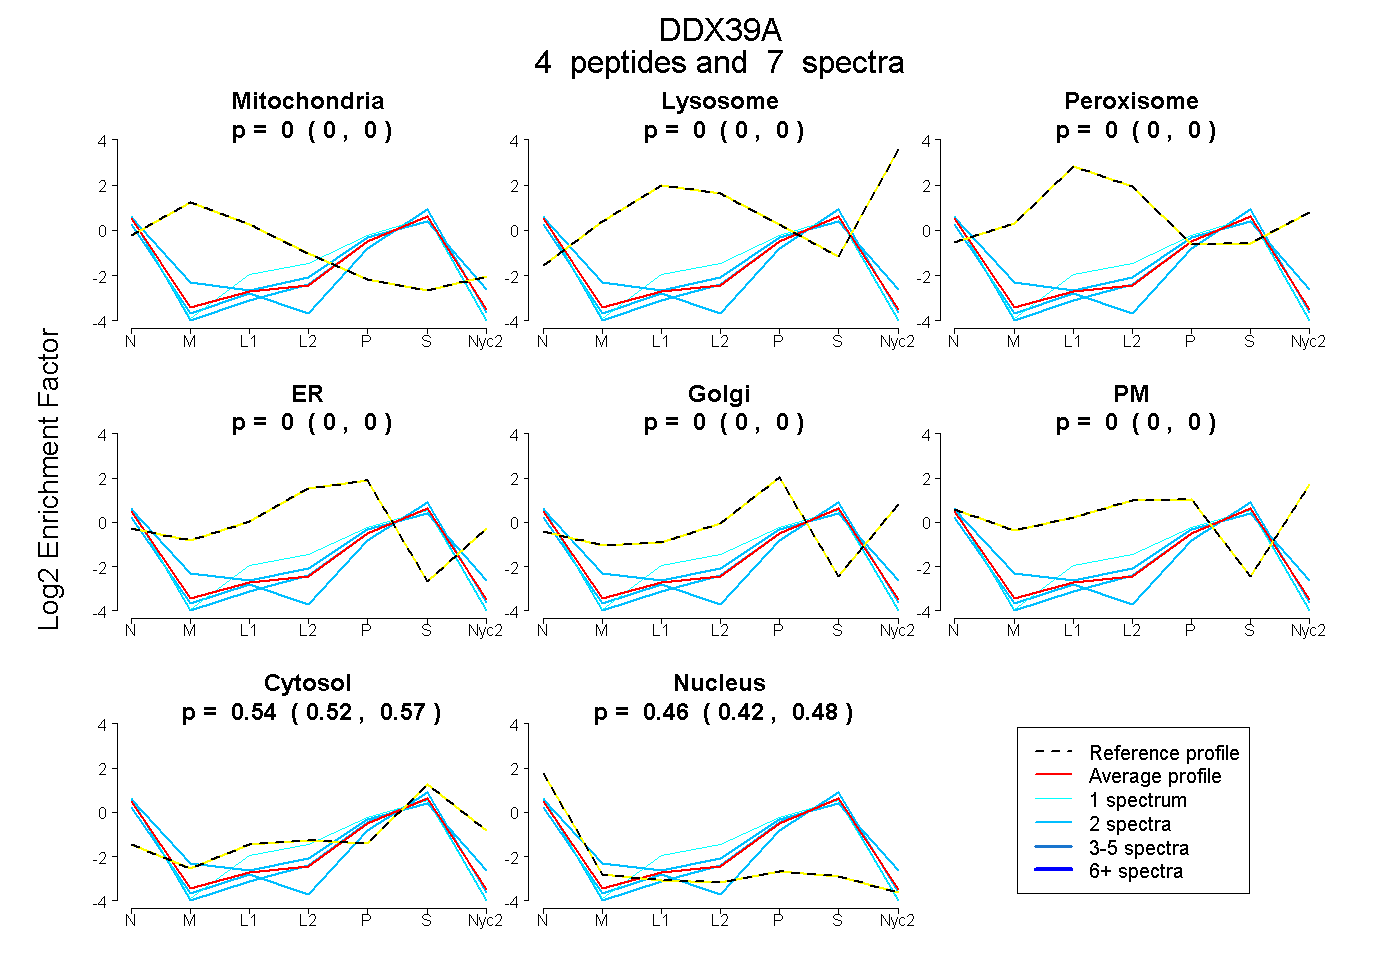
| Plot | Mito | Lyso | Perox | ER | Golgi | PM | Cytosol | Nucleus | |||||
| Expt A |
4 peptides |
7 spectra |
|
0.000 0.000 | 0.000 |
0.000 0.000 | 0.000 |
0.000 0.000 | 0.000 |
0.000 0.000 | 0.000 |
0.000 0.000 | 0.000 |
0.000 0.000 | 0.000 |
0.544 0.517 | 0.570 |
0.456 0.425 | 0.478 |
| 2 spectra, FMQDPMEVFVDDETK | 0.000 | 0.000 | 0.000 | 0.000 | 0.000 | 0.000 | 0.515 | 0.485 | ||
| 1 spectrum, LTPHEK | 0.000 | 0.000 | 0.000 | 0.025 | 0.000 | 0.000 | 0.553 | 0.422 | ||
| 2 spectra, VSVFFGGLSIK | 0.000 | 0.000 | 0.000 | 0.000 | 0.068 | 0.000 | 0.546 | 0.386 | ||
| 2 spectra, GLAVTFVSDENDAK | 0.000 | 0.000 | 0.000 | 0.000 | 0.000 | 0.000 | 0.487 | 0.513 |
| Plot | Mito | Lyso or Perox | ER | Golgi | PM | Cytosol | Nucleus | ||||||
| Expt B |
3 peptides |
7 spectra |
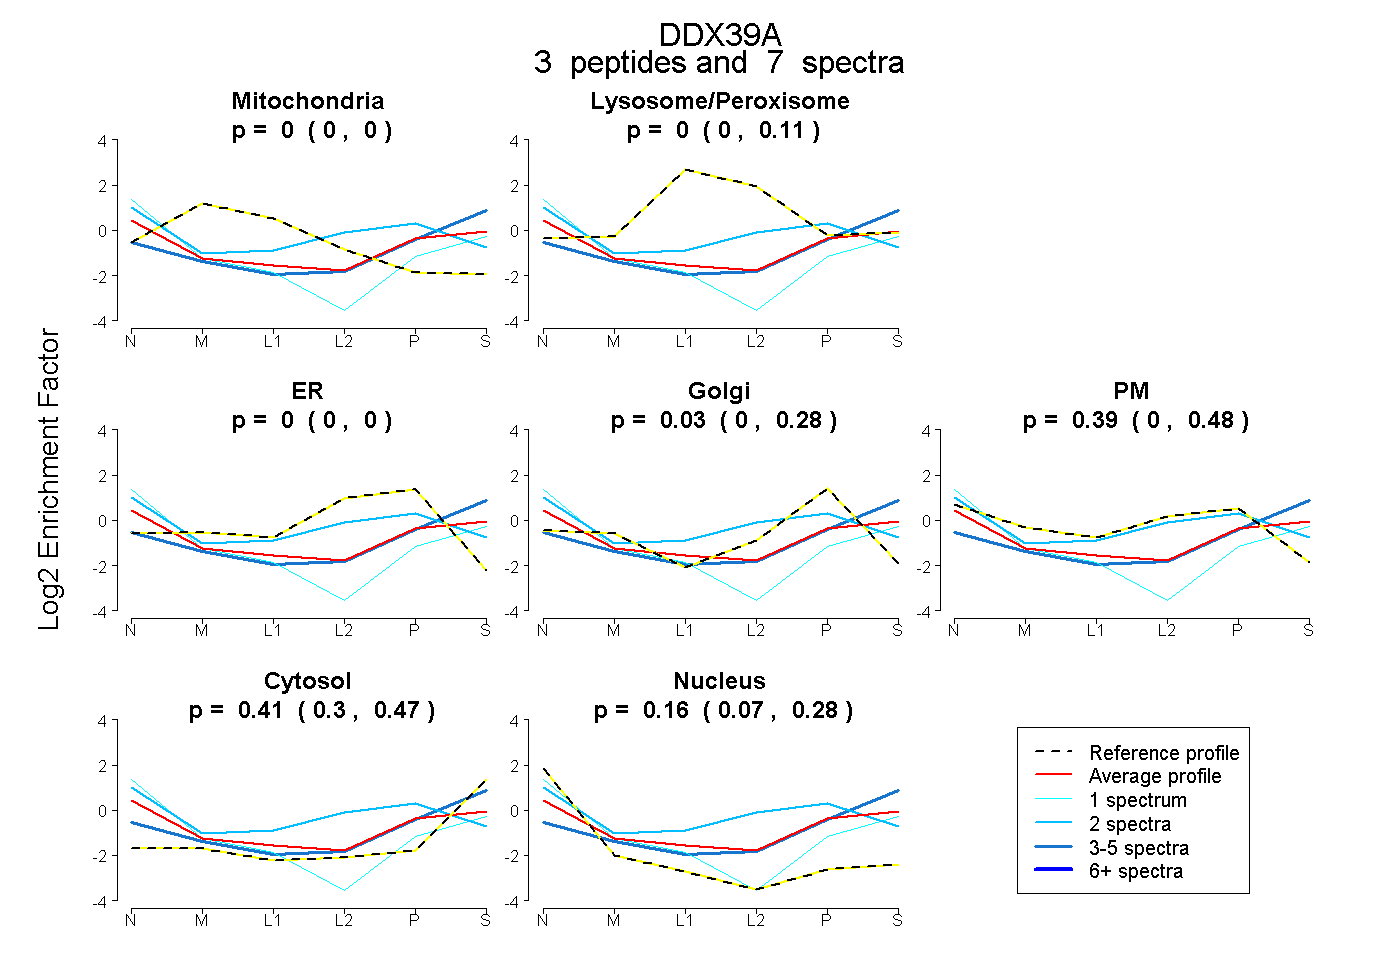 |
0.000 0.000 | 0.000 |
0.000 0.000 | 0.109 |
0.000 0.000 | 0.000 |
0.029 0.000 | 0.284 |
0.394 0.000 | 0.483 |
0.415 0.298 | 0.472 |
0.162 0.072 | 0.279 |
|||
| Plot | Lyso | Other | |||||||||||
| Expt C |
1 peptide |
1 spectrum |
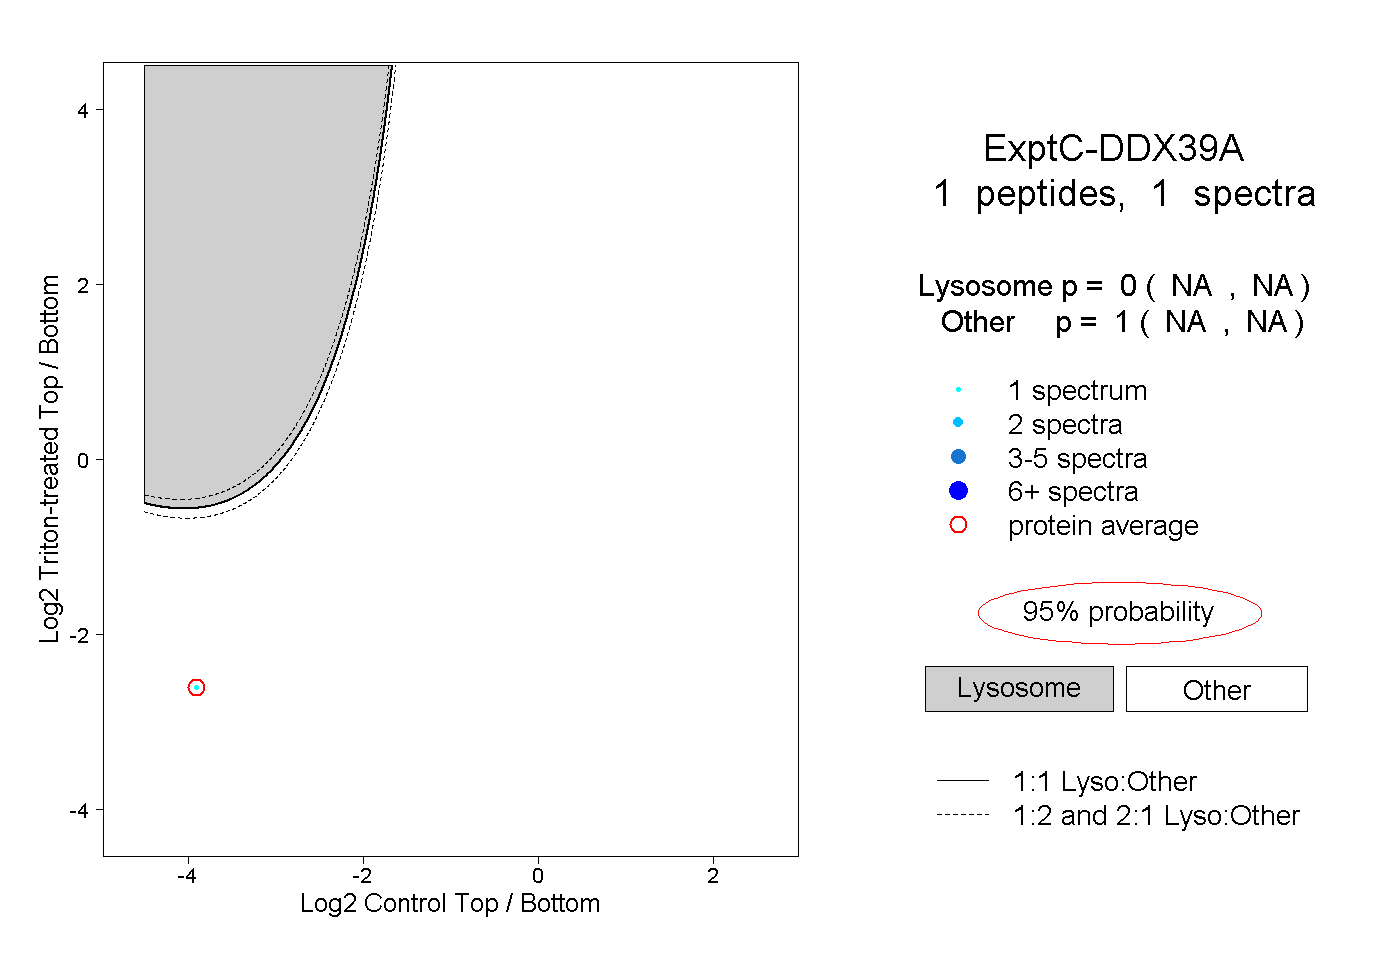 |
0.000 NA | NA |
1.000 NA | NA |