 5
5peptides
spectra
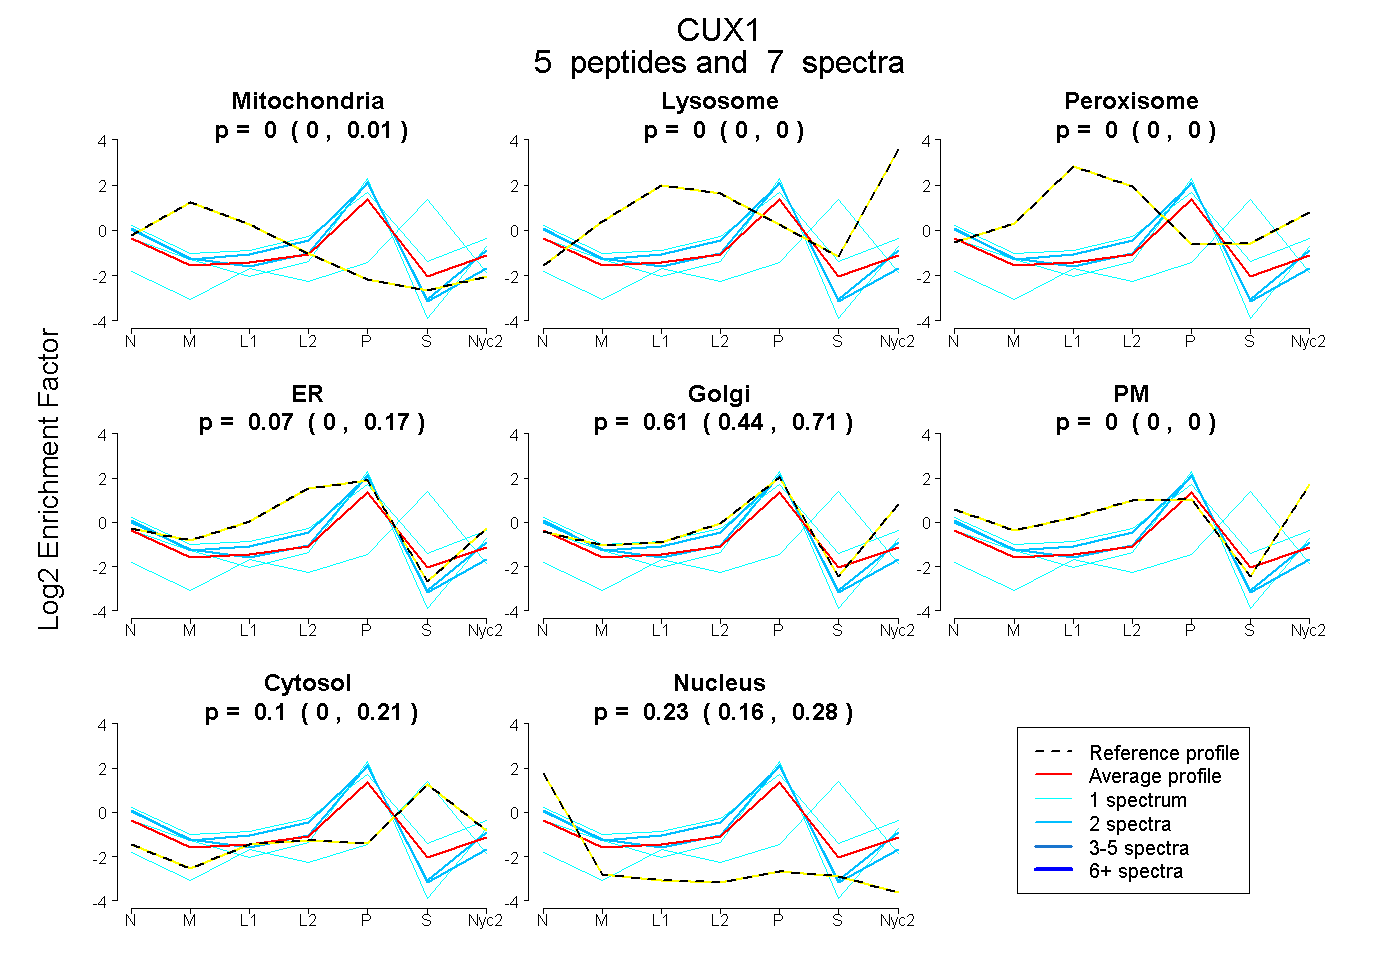
0.000 | 0.008
0.000 | 0.000
0.000 | 0.000
0.000 | 0.171
0.442 | 0.713
0.000 | 0.000
0.000 | 0.207
0.160 | 0.281
1peptide
spectrum
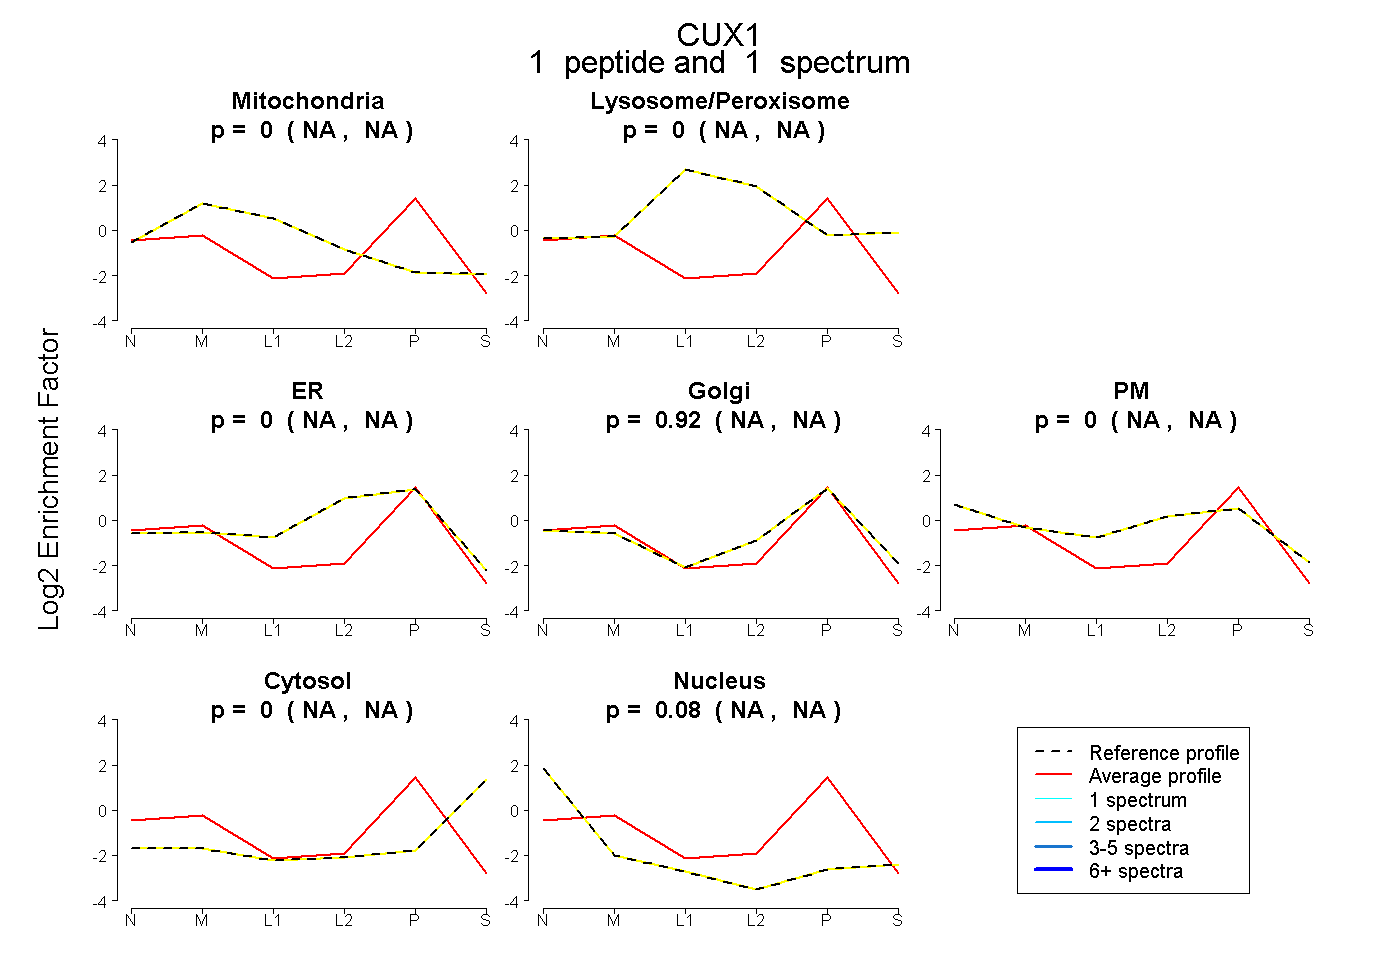
NA | NA
NA | NA
NA | NA
NA | NA
NA | NA
NA | NA
NA | NA
3peptides
spectra
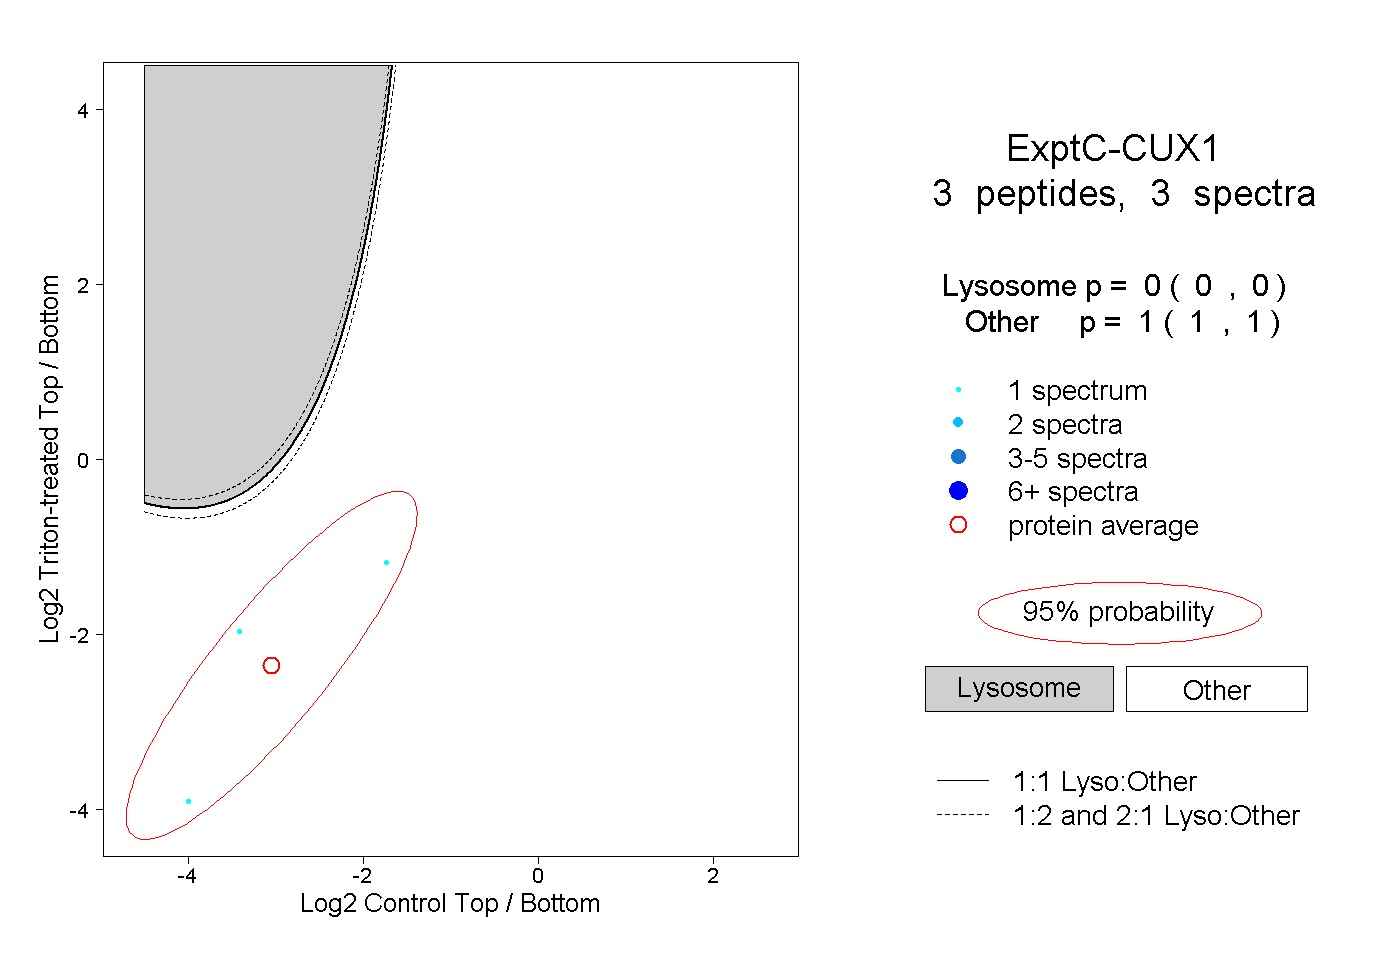
0.000 | 0.000
1.000 | 1.000