 7
7peptides
spectra
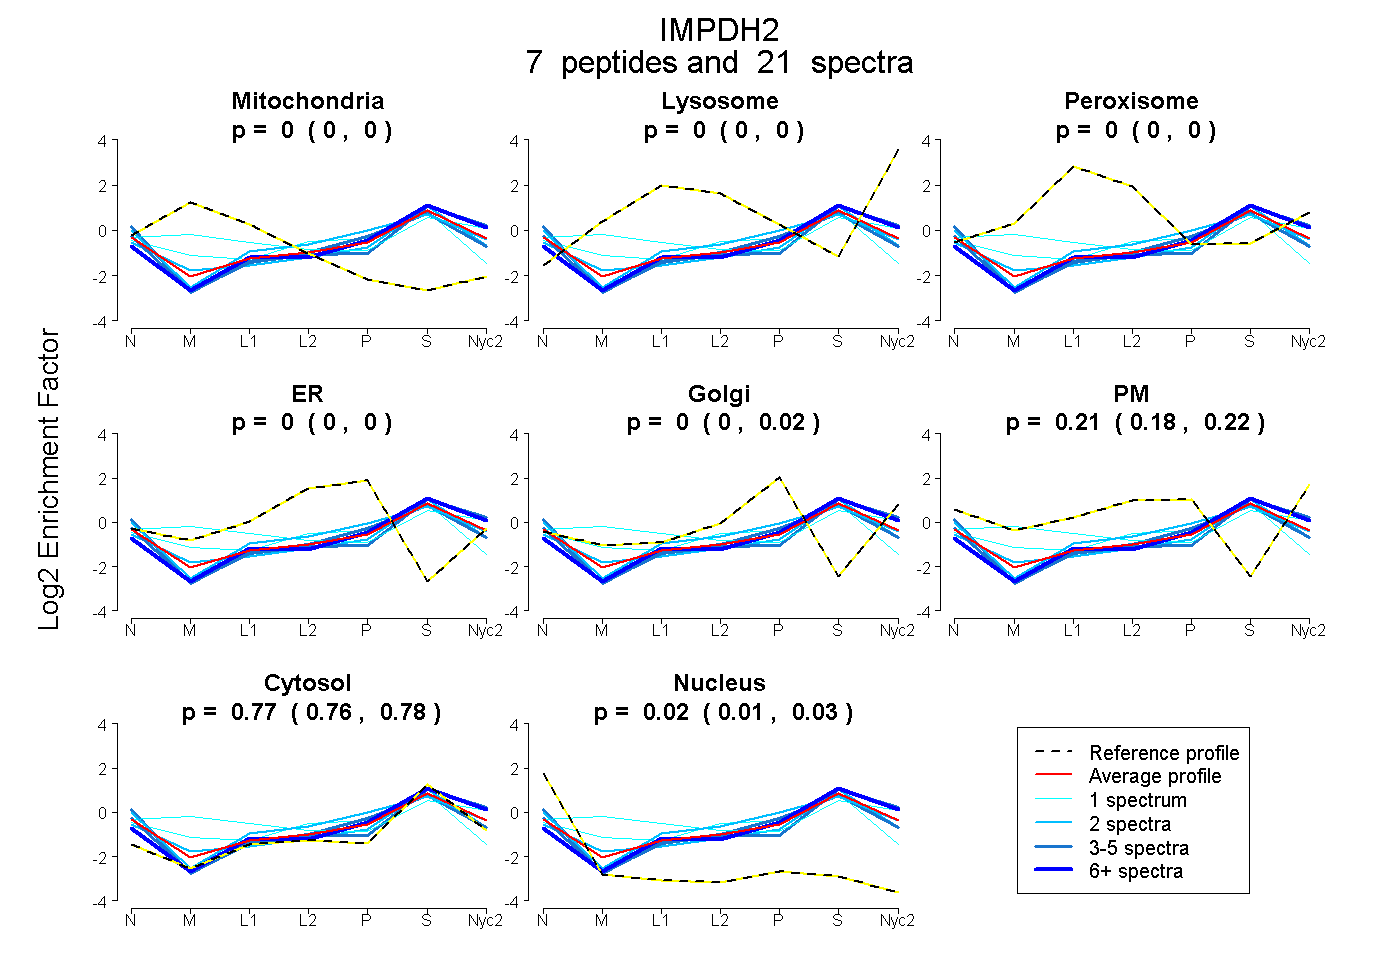
0.000 | 0.000
0.000 | 0.000
0.000 | 0.000
0.000 | 0.000
0.000 | 0.020
0.181 | 0.216
0.759 | 0.778
0.014 | 0.031
4peptides
spectra
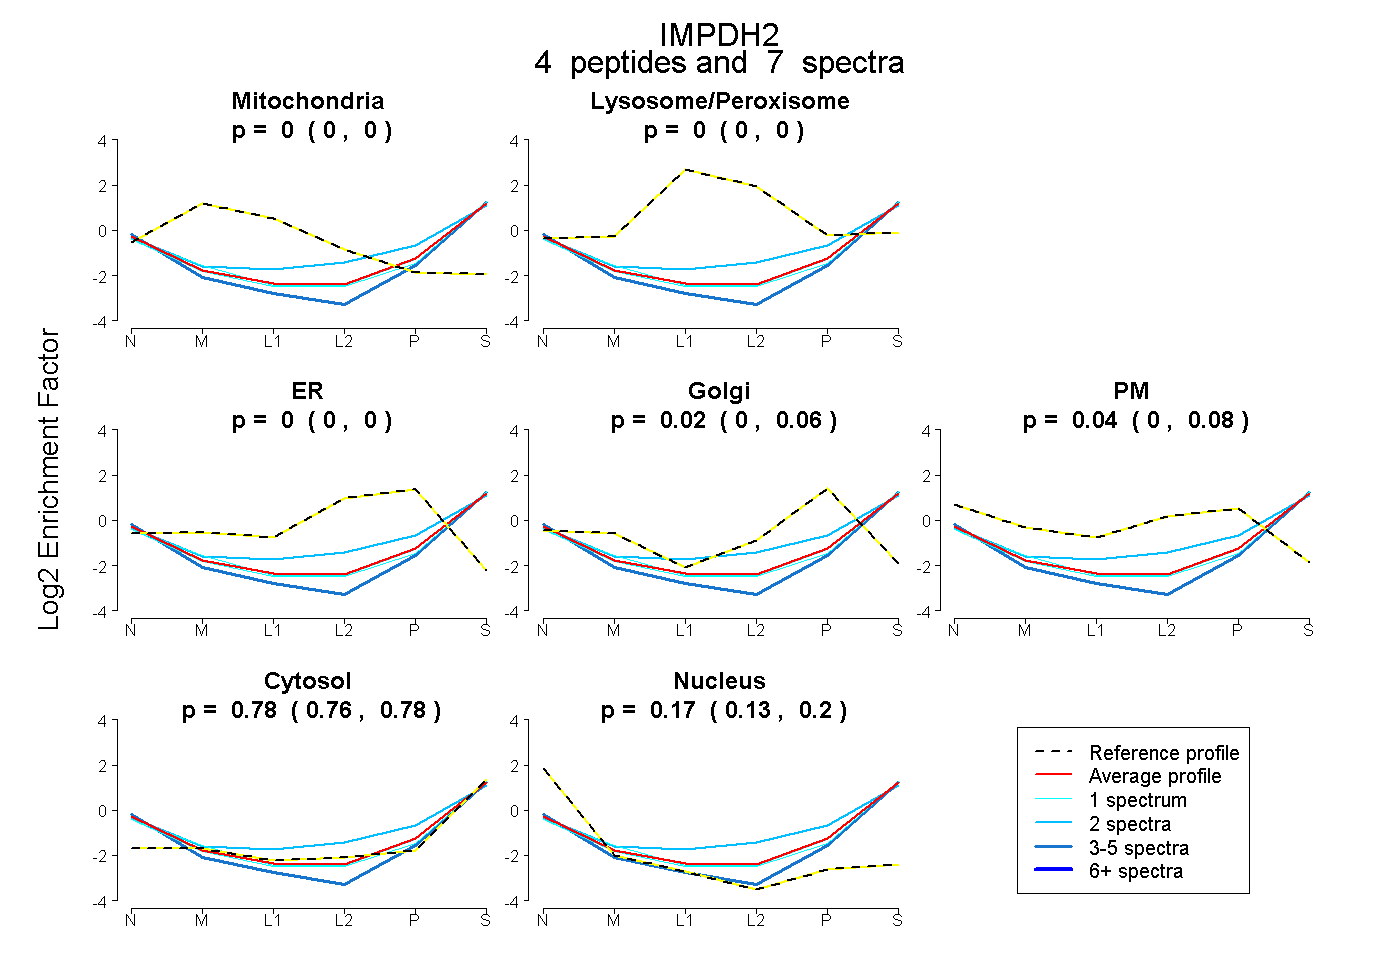
0.000 | 0.000
0.000 | 0.000
0.000 | 0.000
0.000 | 0.059
0.000 | 0.084
0.761 | 0.785
0.135 | 0.199
6peptides
spectra
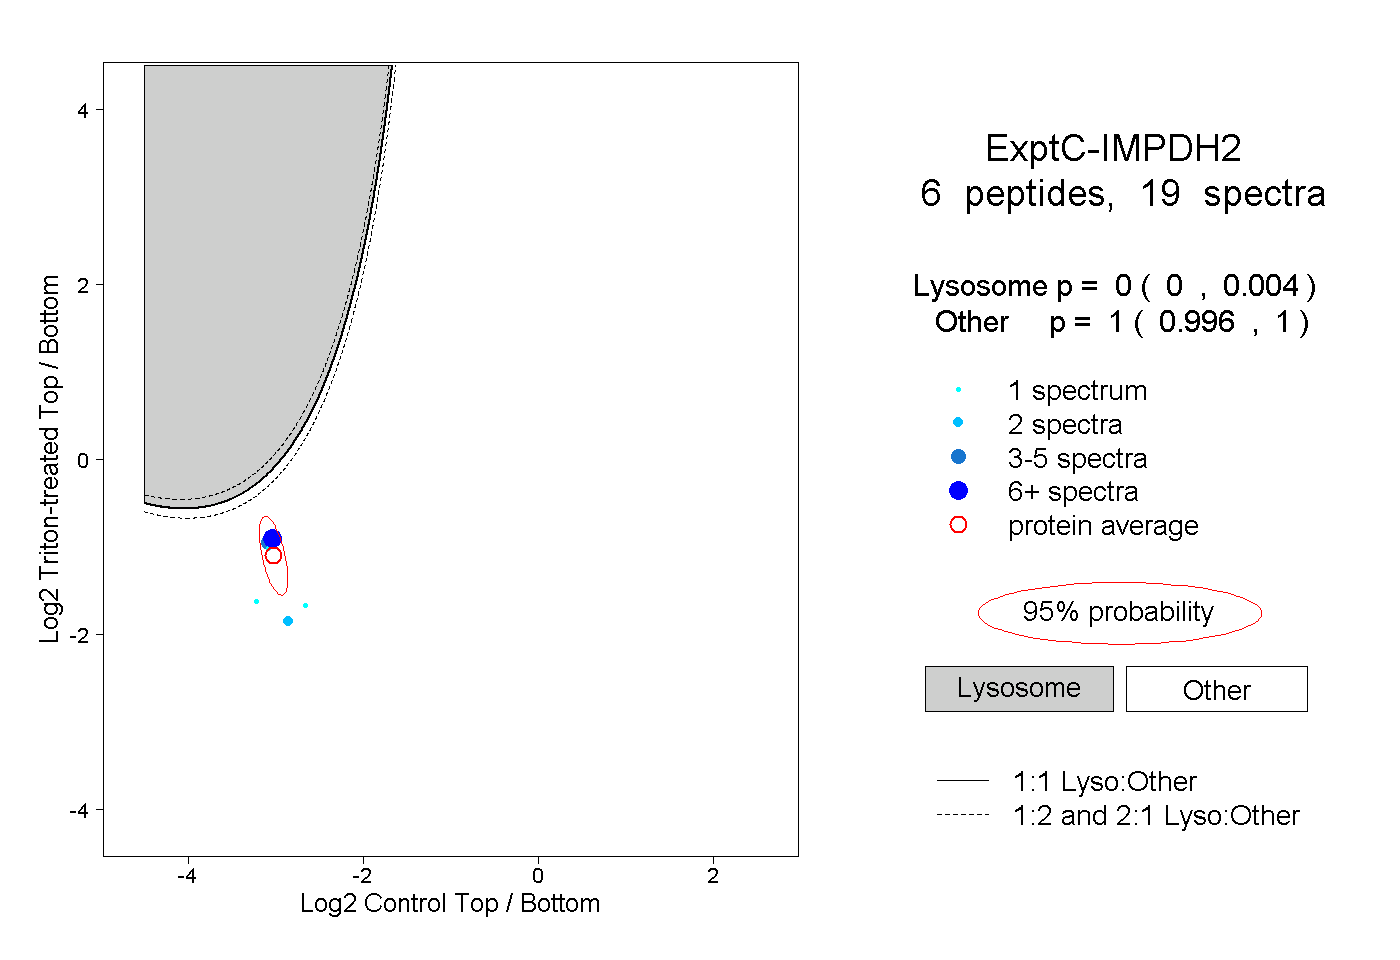
0.000 | 0.004
0.996 | 1.000