 7
7peptides
spectra
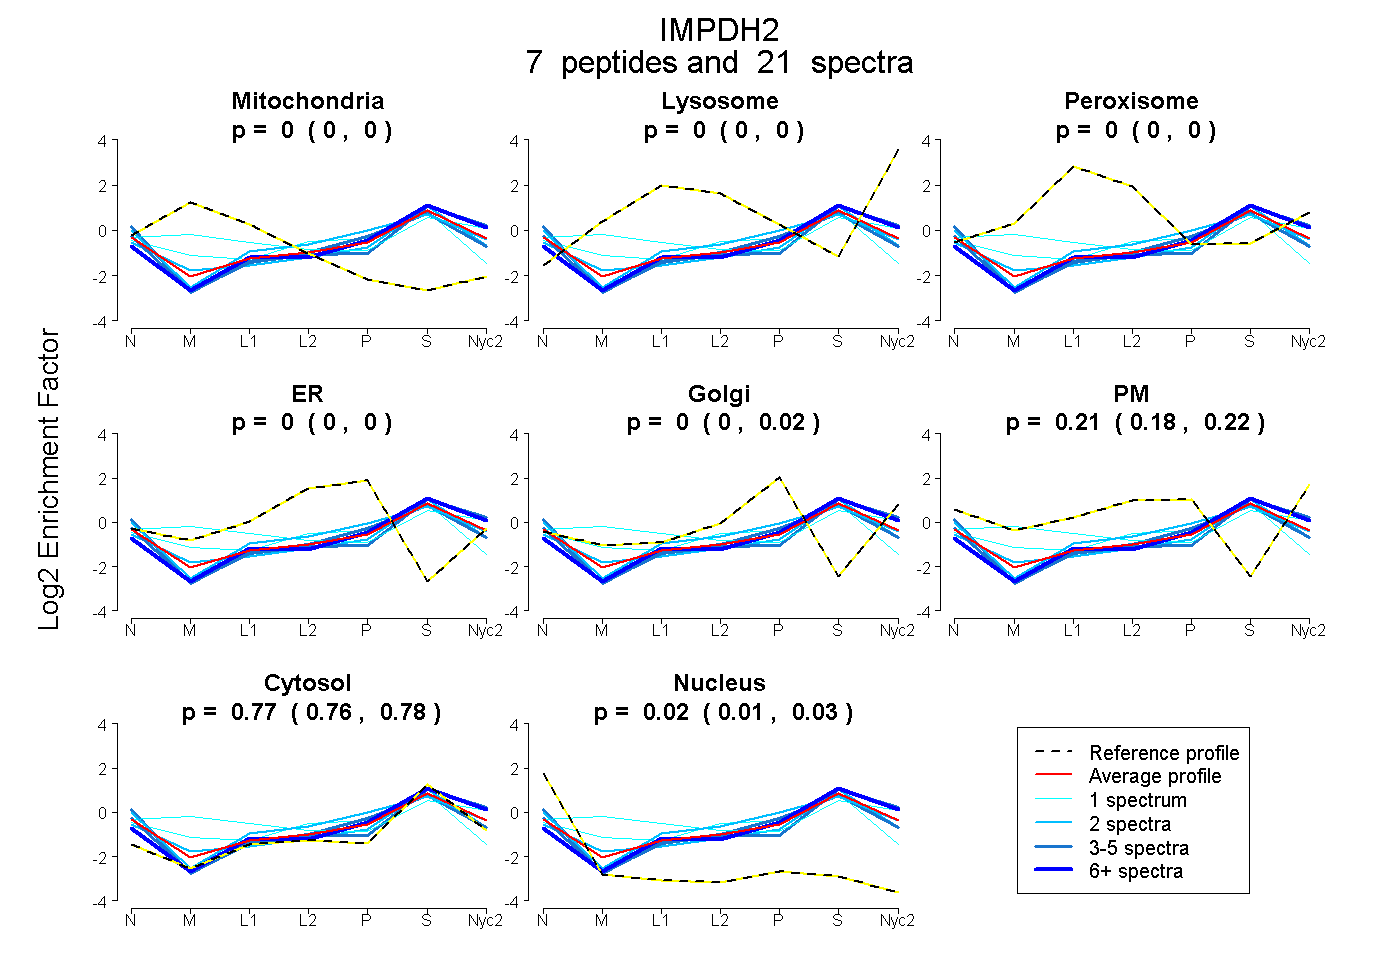
0.000 | 0.000
0.000 | 0.000
0.000 | 0.000
0.000 | 0.000
0.000 | 0.020
0.181 | 0.216
0.759 | 0.778
0.014 | 0.031
| Plot | Mito | Lyso | Perox | ER | Golgi | PM | Cytosol | Nucleus | |||||
| Expt A |
7 peptides |
21 spectra |
|
0.000 0.000 | 0.000 |
0.000 0.000 | 0.000 |
0.000 0.000 | 0.000 |
0.000 0.000 | 0.000 |
0.000 0.000 | 0.020 |
0.207 0.181 | 0.216 |
0.769 0.759 | 0.778 |
0.023 0.014 | 0.031 |
| 6 spectra, VSEYAR | 0.000 | 0.002 | 0.000 | 0.000 | 0.090 | 0.089 | 0.820 | 0.000 | ||
| 2 spectra, EANEILQR | 0.000 | 0.000 | 0.000 | 0.000 | 0.021 | 0.123 | 0.818 | 0.038 | ||
| 1 spectrum, HGFCGIPITDTGR | 0.110 | 0.000 | 0.000 | 0.199 | 0.000 | 0.000 | 0.690 | 0.000 | ||
| 5 spectra, NLIDAGVDALR | 0.000 | 0.000 | 0.000 | 0.000 | 0.000 | 0.160 | 0.838 | 0.002 | ||
| 2 spectra, VAQGVSGAVQDK | 0.000 | 0.000 | 0.000 | 0.063 | 0.034 | 0.186 | 0.704 | 0.012 | ||
| 1 spectrum, SLTQVR | 0.202 | 0.154 | 0.029 | 0.000 | 0.000 | 0.088 | 0.527 | 0.000 | ||
| 4 spectra, LVGIISSR | 0.000 | 0.000 | 0.000 | 0.000 | 0.097 | 0.108 | 0.710 | 0.085 |
| Plot | Mito | Lyso or Perox | ER | Golgi | PM | Cytosol | Nucleus | ||||||
| Expt B |
4 peptides |
7 spectra |
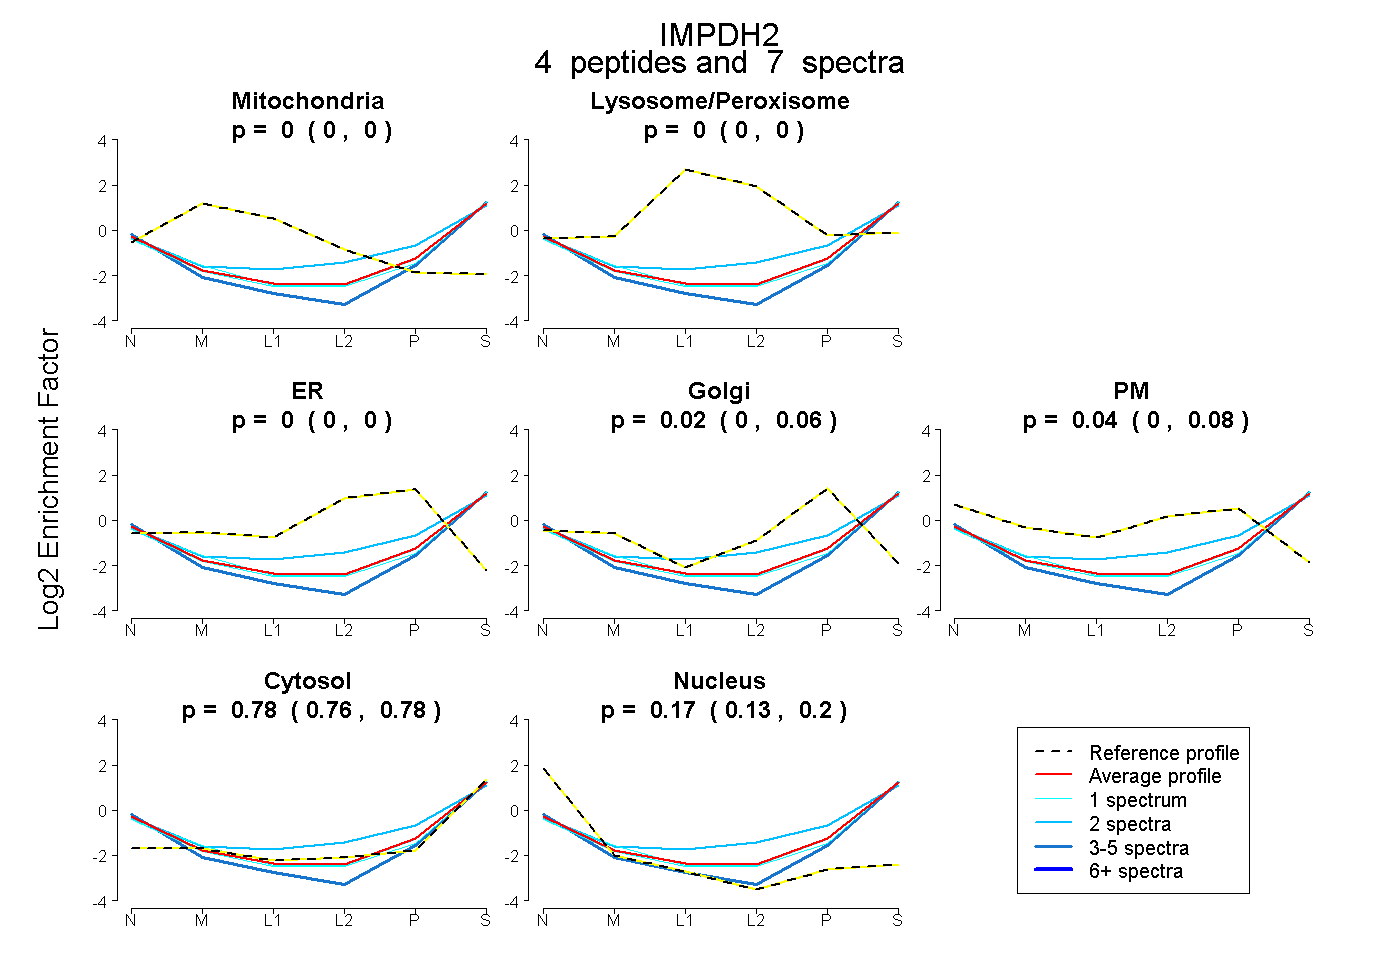 |
0.000 0.000 | 0.000 |
0.000 0.000 | 0.000 |
0.000 0.000 | 0.000 |
0.016 0.000 | 0.059 |
0.038 0.000 | 0.084 |
0.775 0.761 | 0.785 |
0.171 0.135 | 0.199 |
|||
| Plot | Lyso | Other | |||||||||||
| Expt C |
6 peptides |
19 spectra |
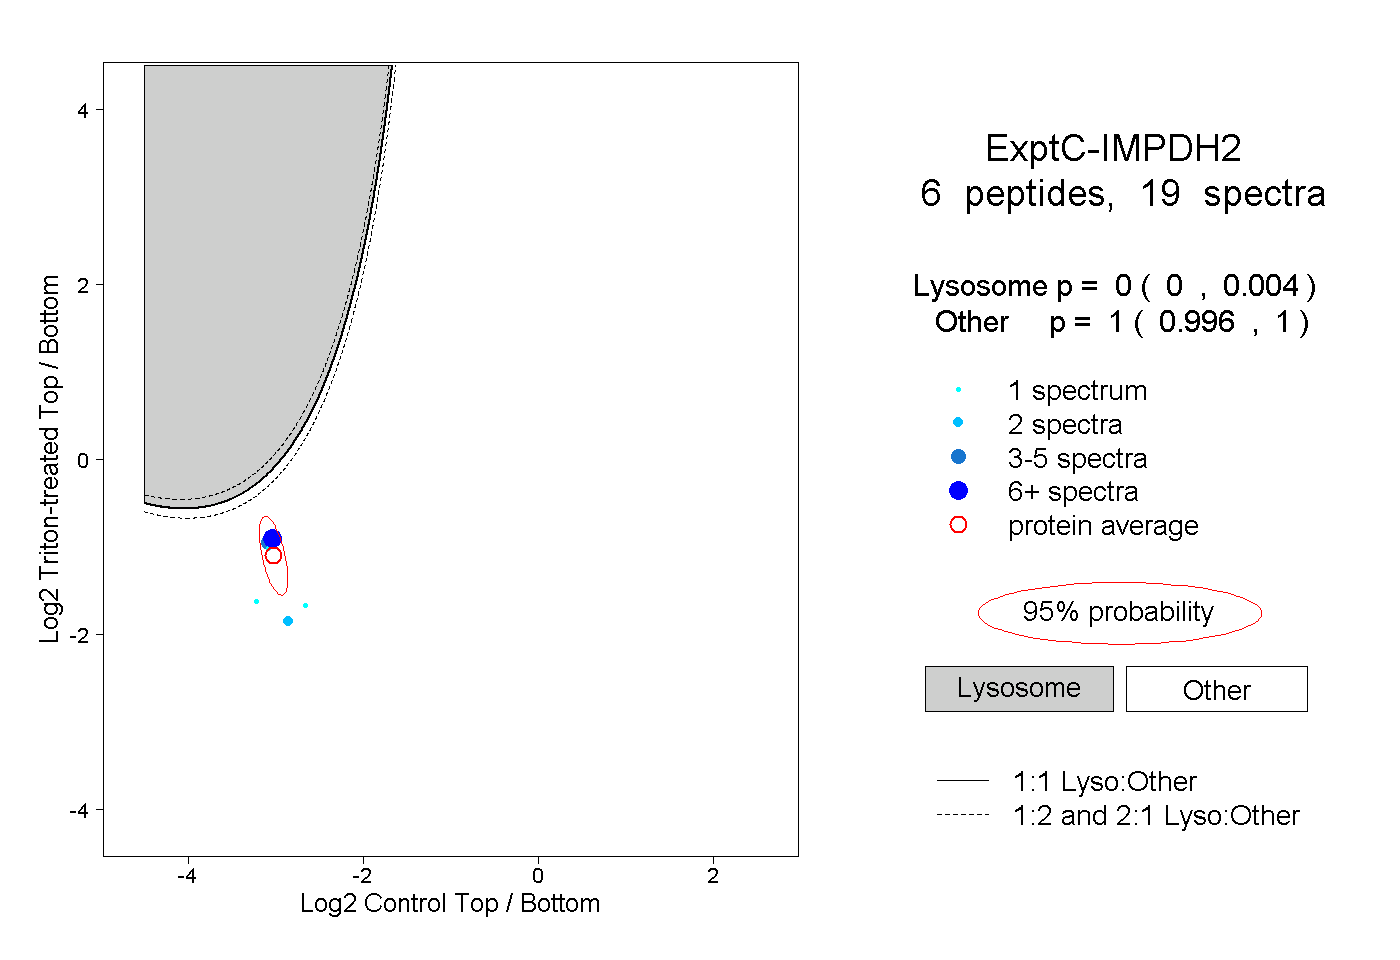 |
0.000 0.000 | 0.004 |
1.000 0.996 | 1.000 |