 3
3peptides
spectra
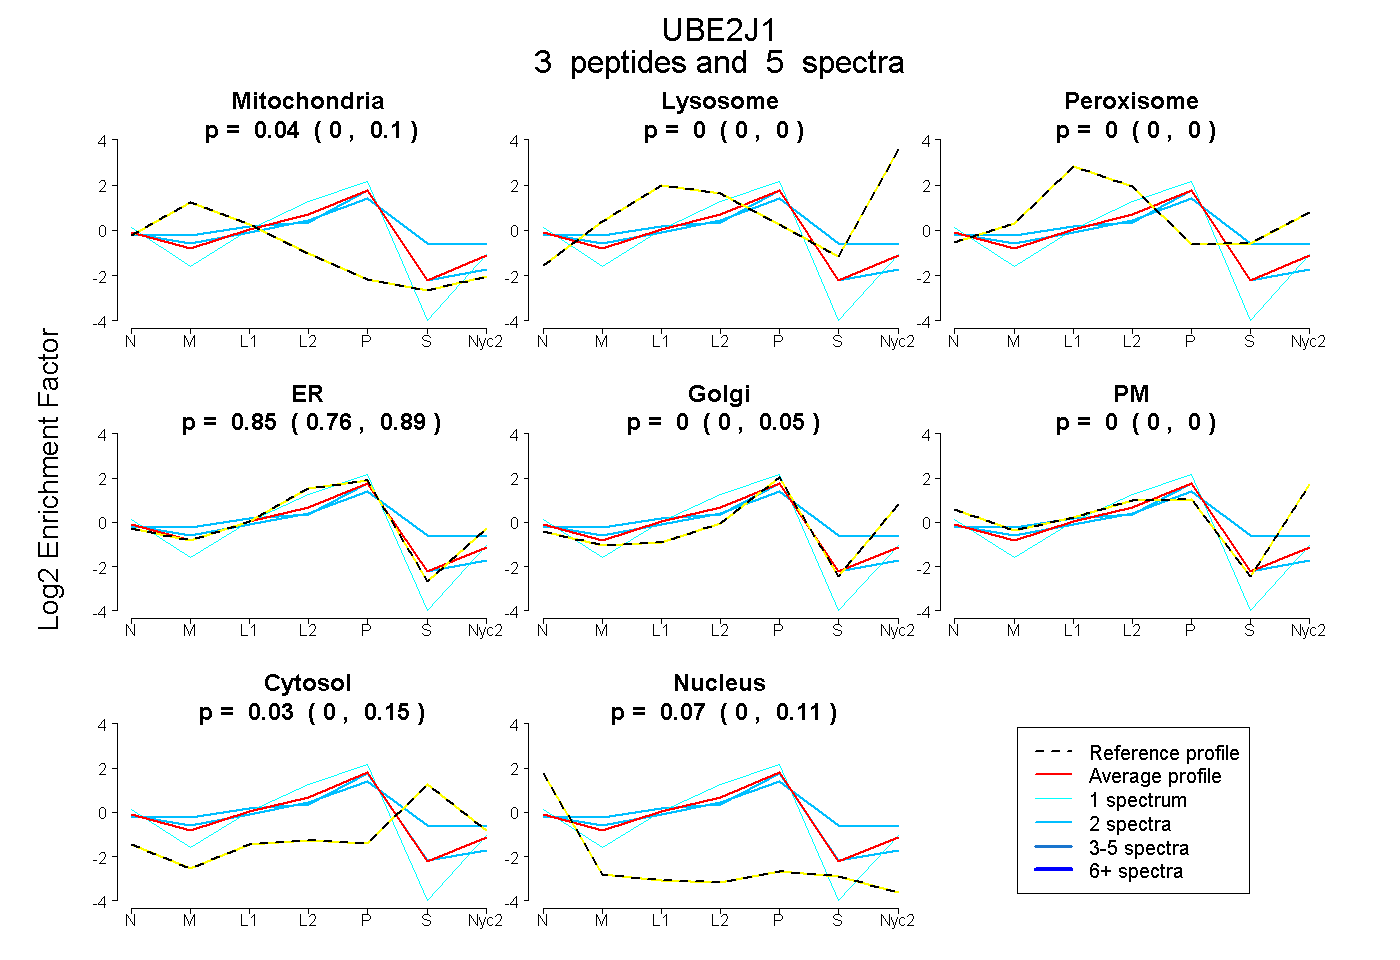
0.000 | 0.103
0.000 | 0.000
0.000 | 0.000
0.757 | 0.885
0.000 | 0.048
0.000 | 0.000
0.000 | 0.151
0.000 | 0.113
2peptides
spectra
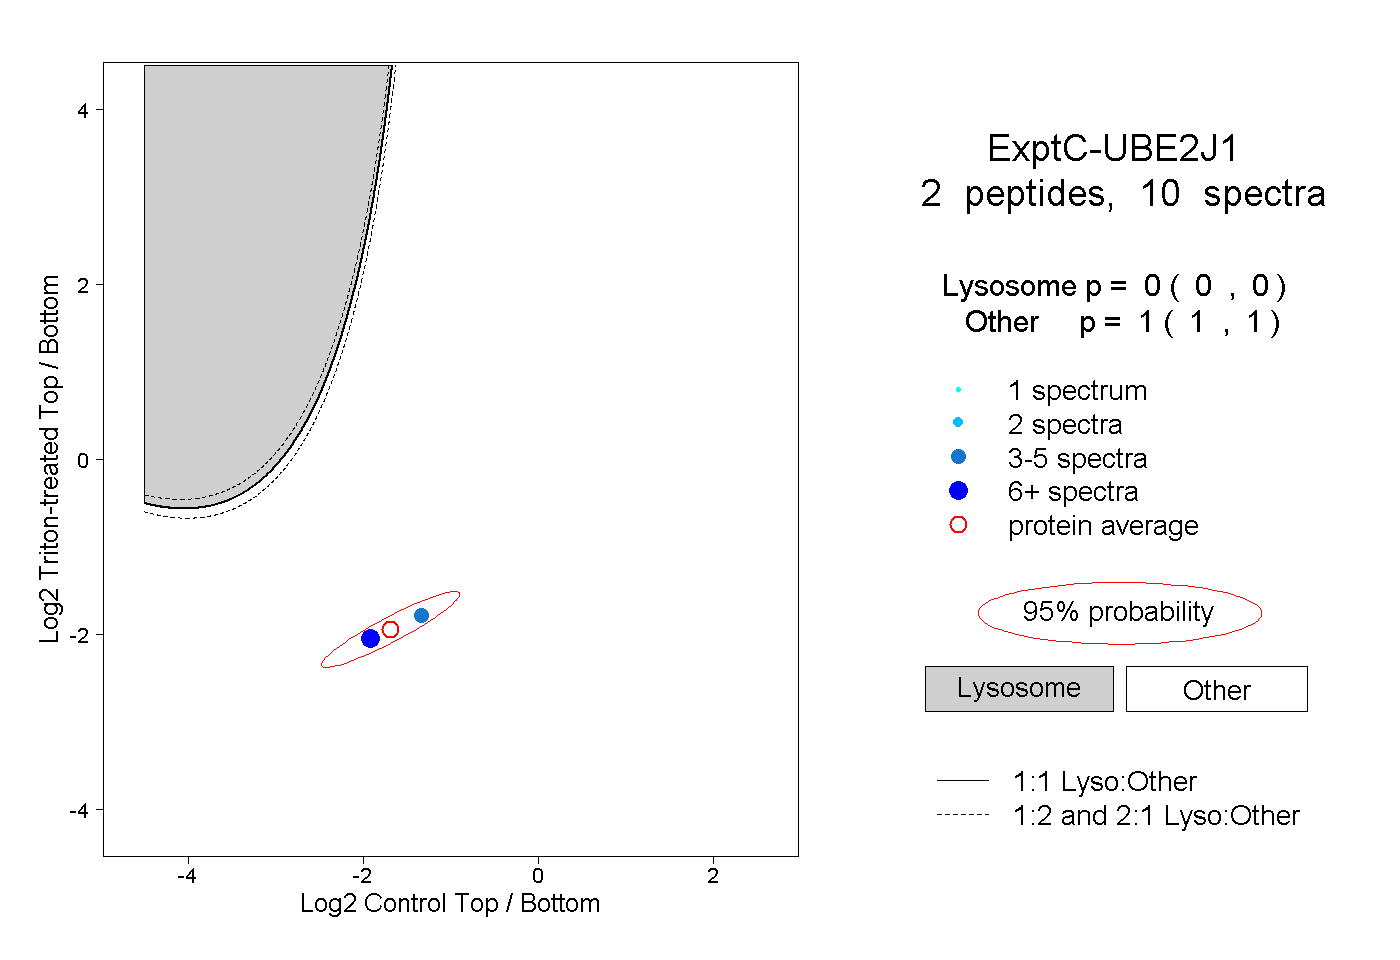
0.000 | 0.000
1.000 | 1.000
2peptides
spectra
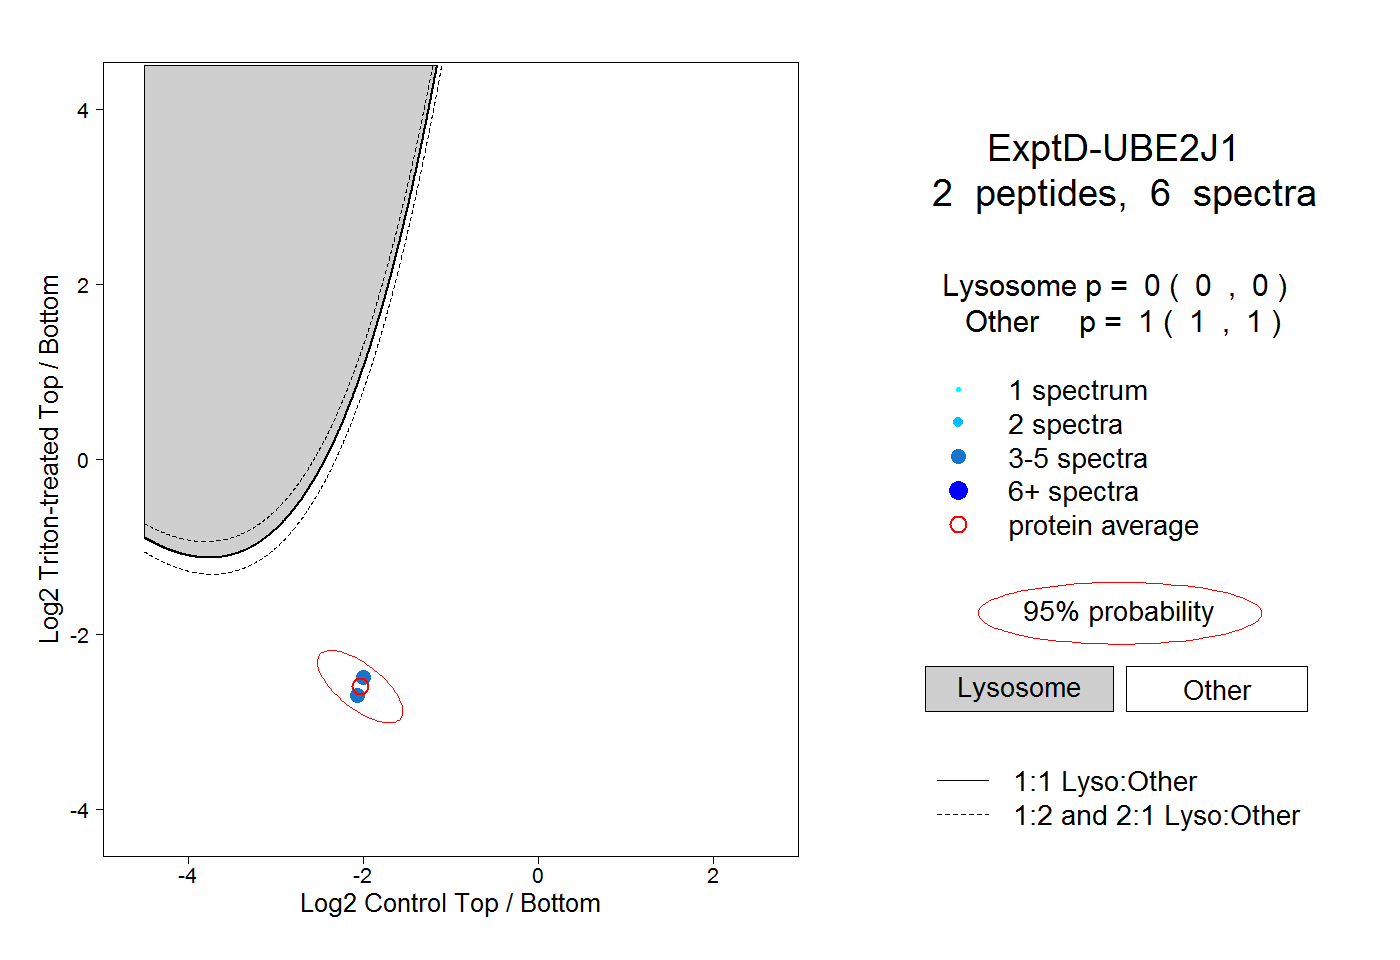
0.000 | 0.000
1.000 | 1.000