 3
3peptides
spectra
0.000 | 0.103
0.000 | 0.000
0.000 | 0.000
0.757 | 0.885
0.000 | 0.048
0.000 | 0.000
0.000 | 0.151
0.000 | 0.113
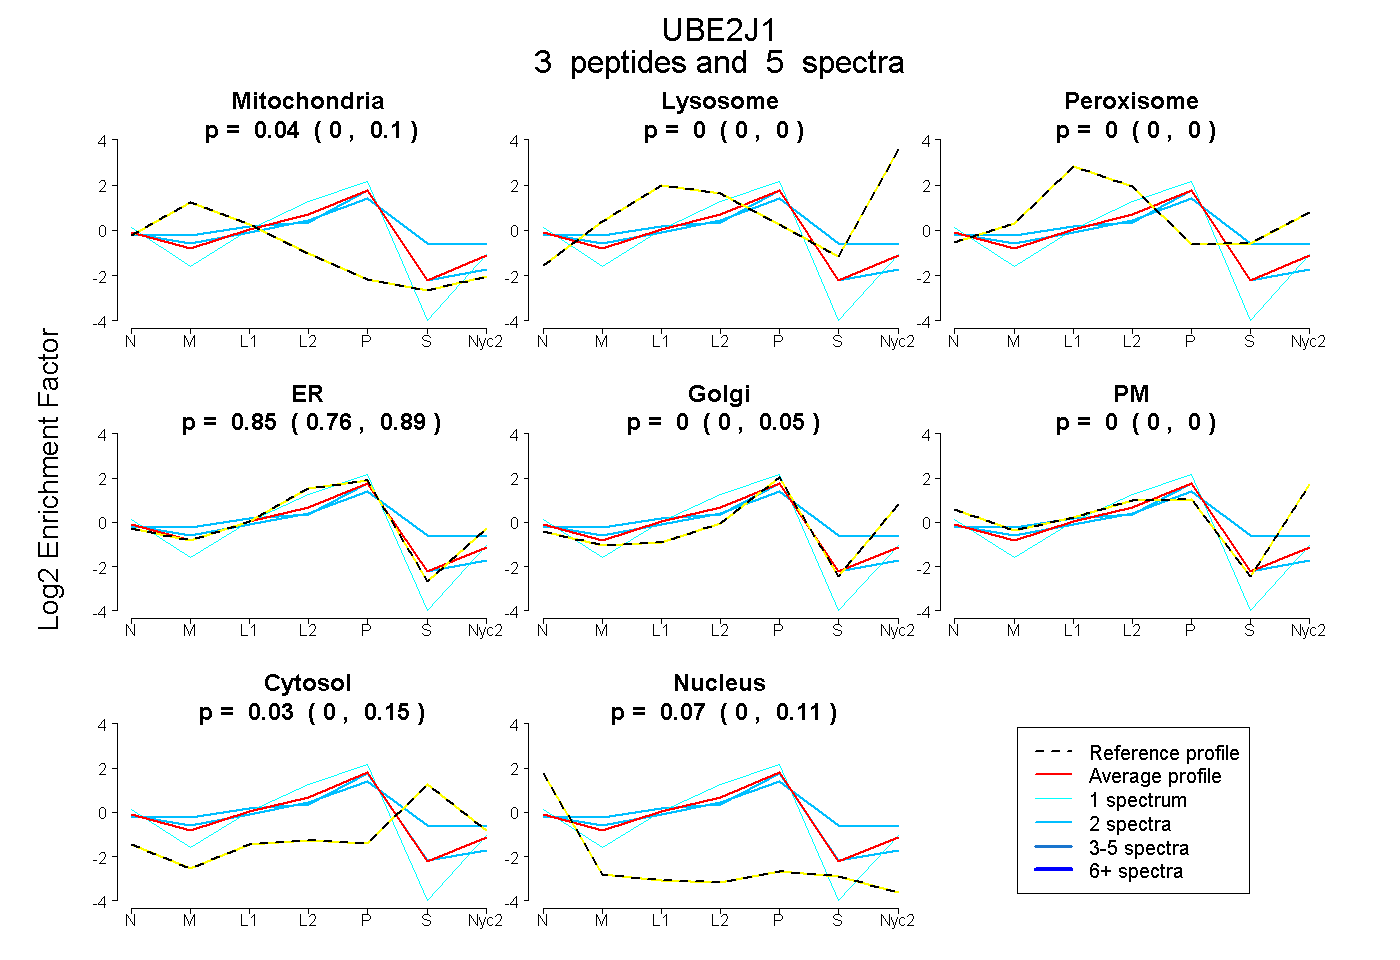
| Plot | Mito | Lyso | Perox | ER | Golgi | PM | Cytosol | Nucleus | |||||
| Expt A |
3 peptides |
5 spectra |
|
0.044 0.000 | 0.103 |
0.000 0.000 | 0.000 |
0.000 0.000 | 0.000 |
0.848 0.757 | 0.885 |
0.000 0.000 | 0.048 |
0.000 0.000 | 0.000 |
0.035 0.000 | 0.151 |
0.073 0.000 | 0.113 |
| 2 spectra, SPAVK | 0.000 | 0.000 | 0.111 | 0.530 | 0.082 | 0.000 | 0.277 | 0.000 | ||
| 1 spectrum, SGIDSSQADQEAK | 0.000 | 0.000 | 0.000 | 0.924 | 0.000 | 0.000 | 0.000 | 0.076 | ||
| 2 spectra, GPPDSDFDGGVYHGR | 0.188 | 0.000 | 0.000 | 0.760 | 0.000 | 0.000 | 0.004 | 0.047 |
| Plot | Lyso | Other | |||||||||||
| Expt C |
2 peptides |
10 spectra |
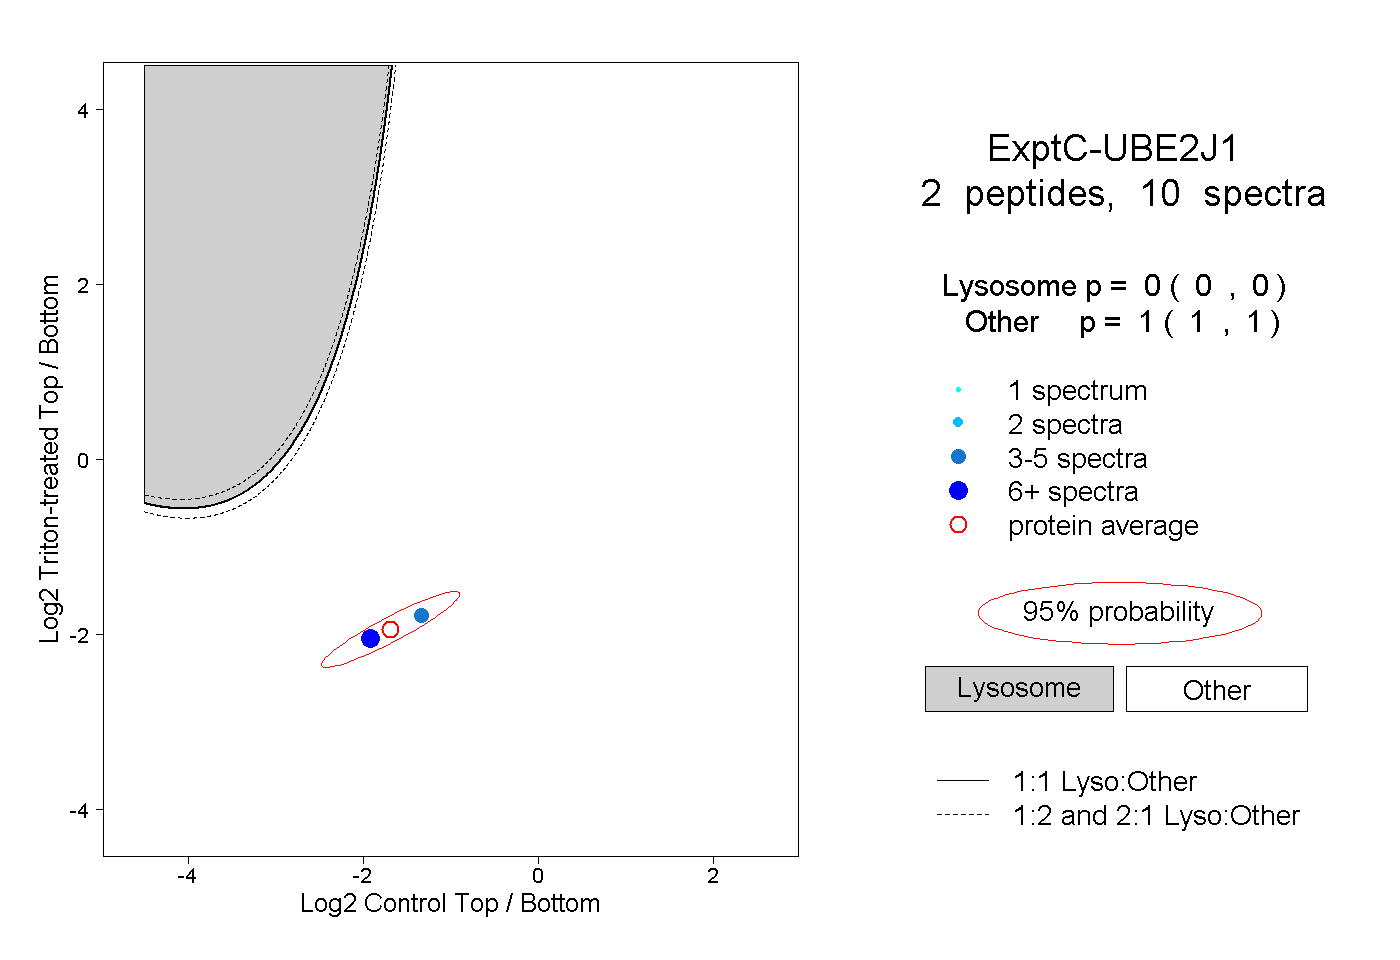 |
0.000 0.000 | 0.000 |
1.000 1.000 | 1.000 |
||||||||
| Plot | Lyso | Other | |||||||||||
| Expt D |
2 peptides |
6 spectra |
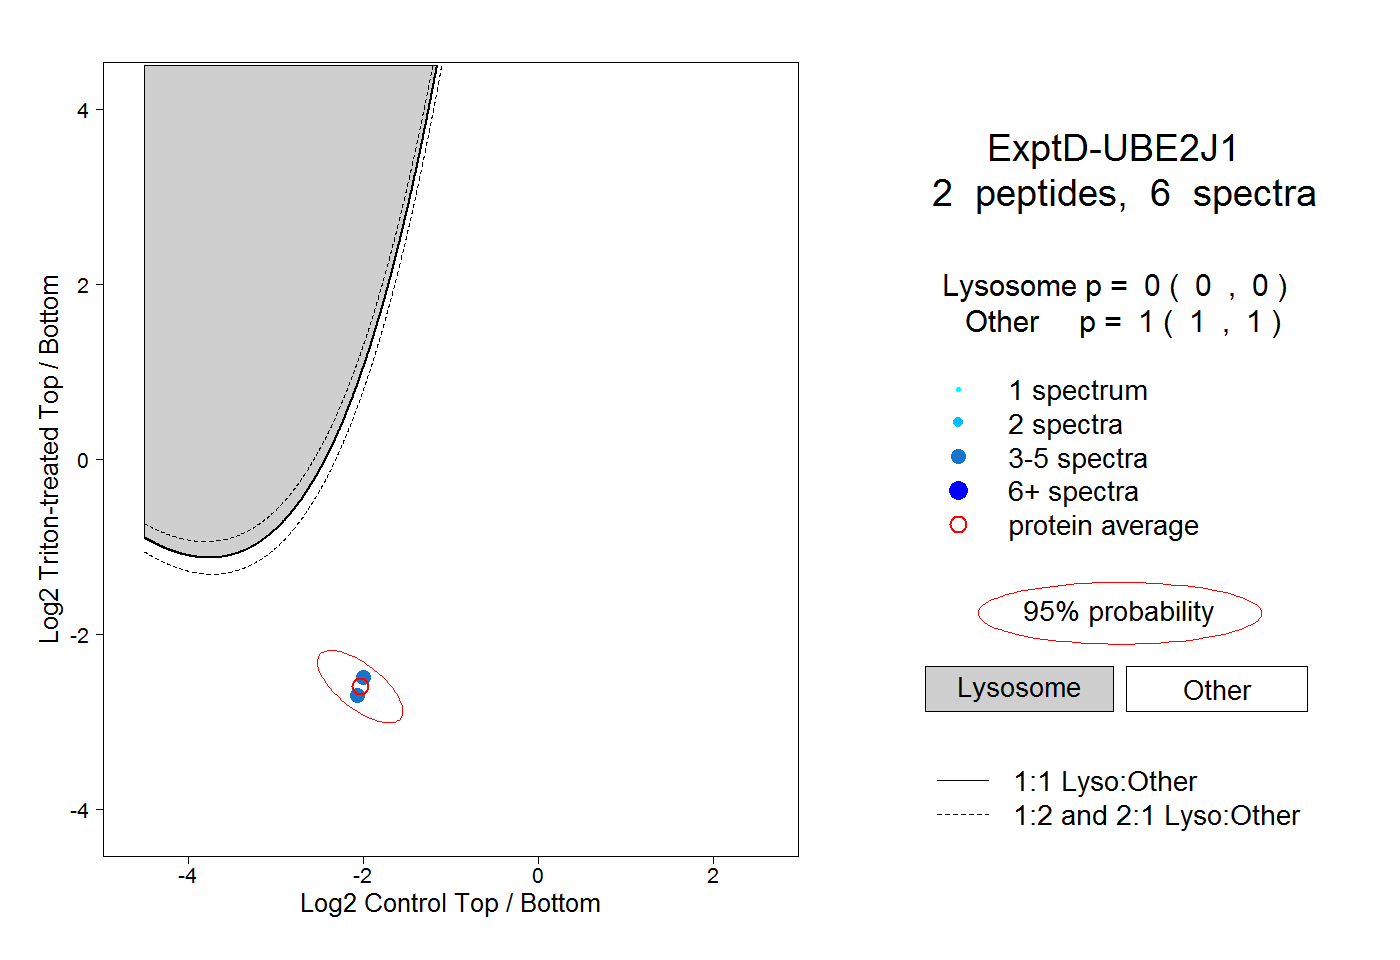 |
0.000 0.000 | 0.000 |
1.000 1.000 | 1.000 |