 13
13peptides
spectra
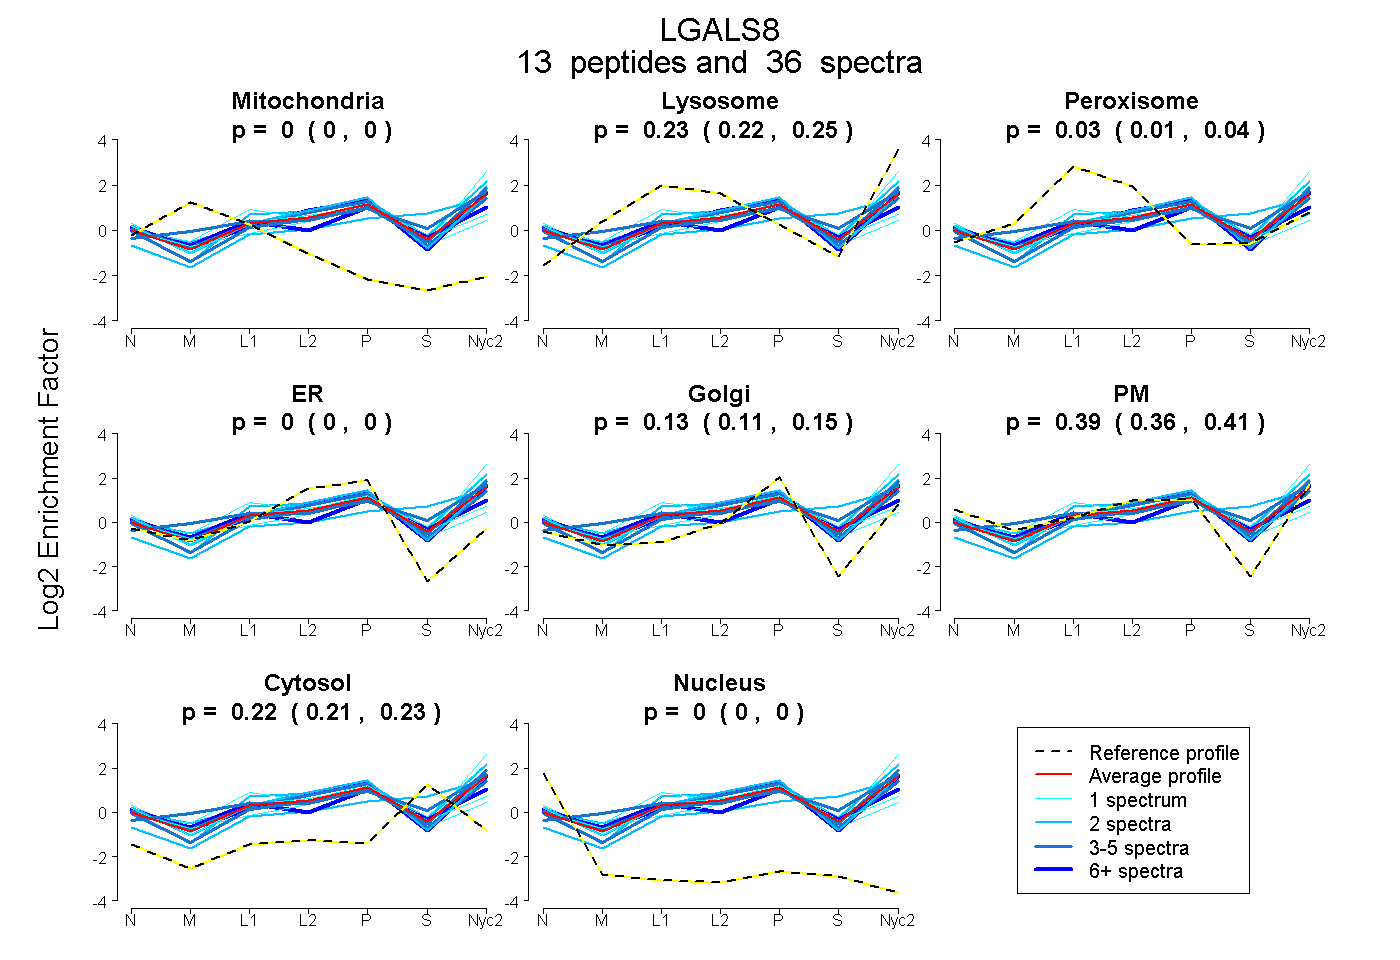
0.000 | 0.000
0.216 | 0.246
0.006 | 0.041
0.000 | 0.000
0.113 | 0.151
0.363 | 0.406
0.215 | 0.229
0.000 | 0.000
3peptides
spectra
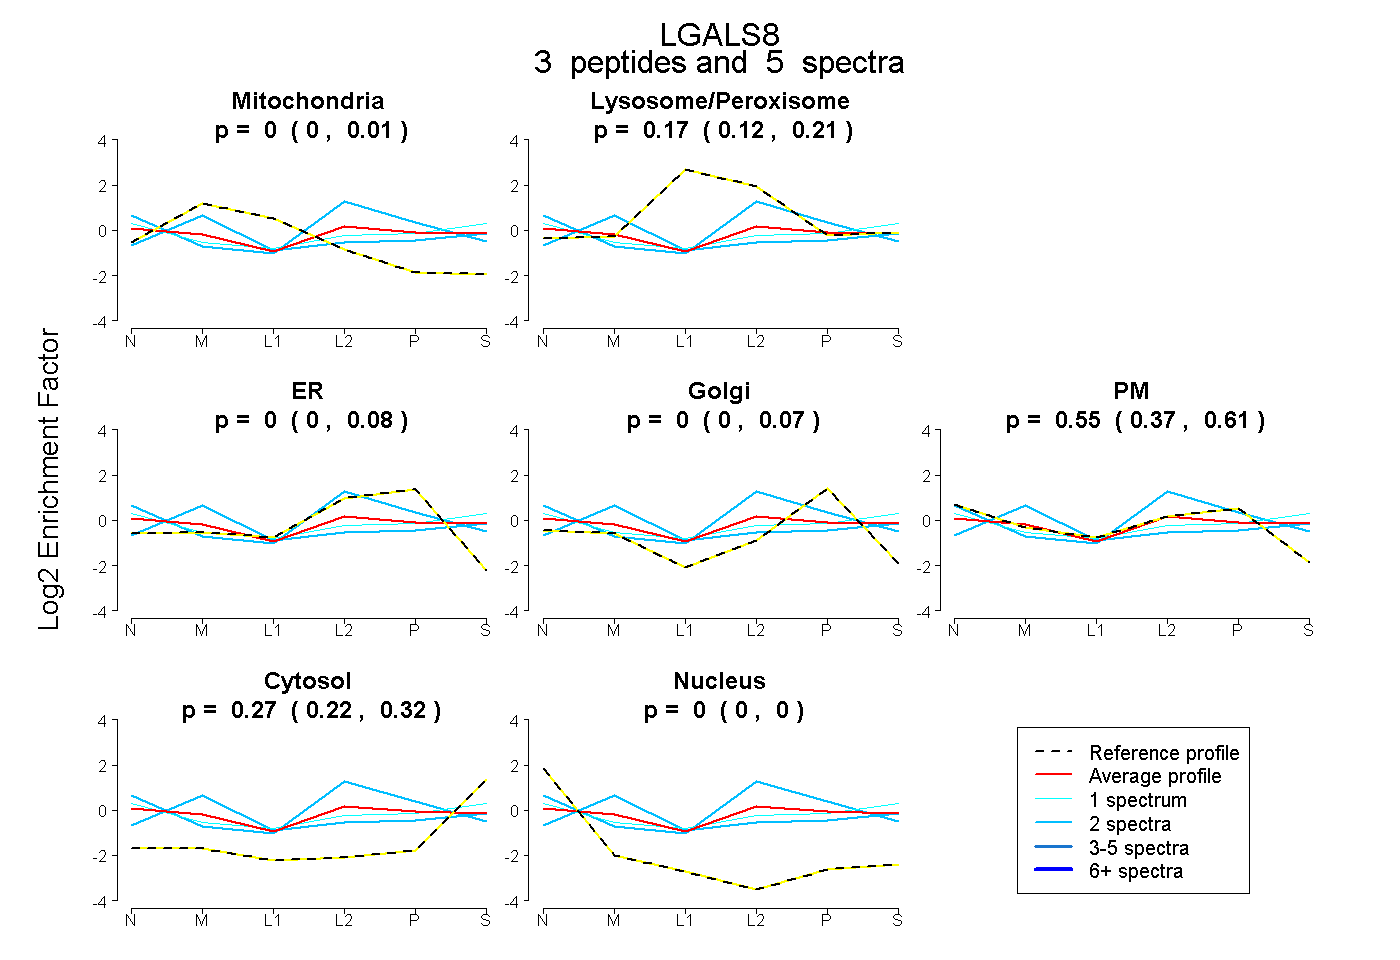
0.000 | 0.010
0.120 | 0.213
0.000 | 0.085
0.000 | 0.069
0.368 | 0.605
0.220 | 0.319
0.000 | 0.000
10peptides
spectra
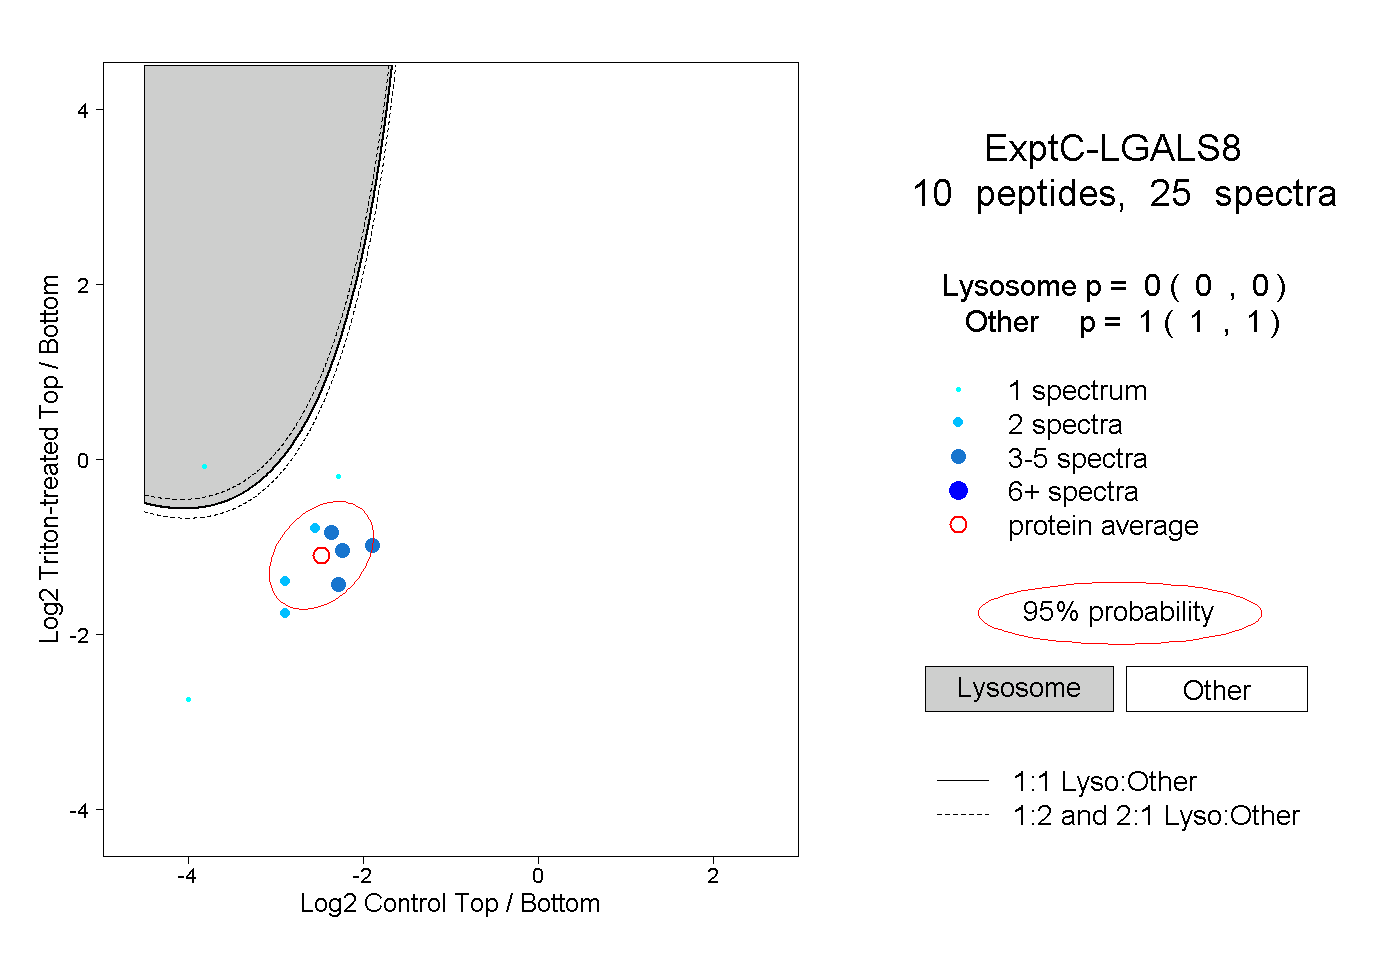
0.000 | 0.000
1.000 | 1.000
1peptide
spectrum
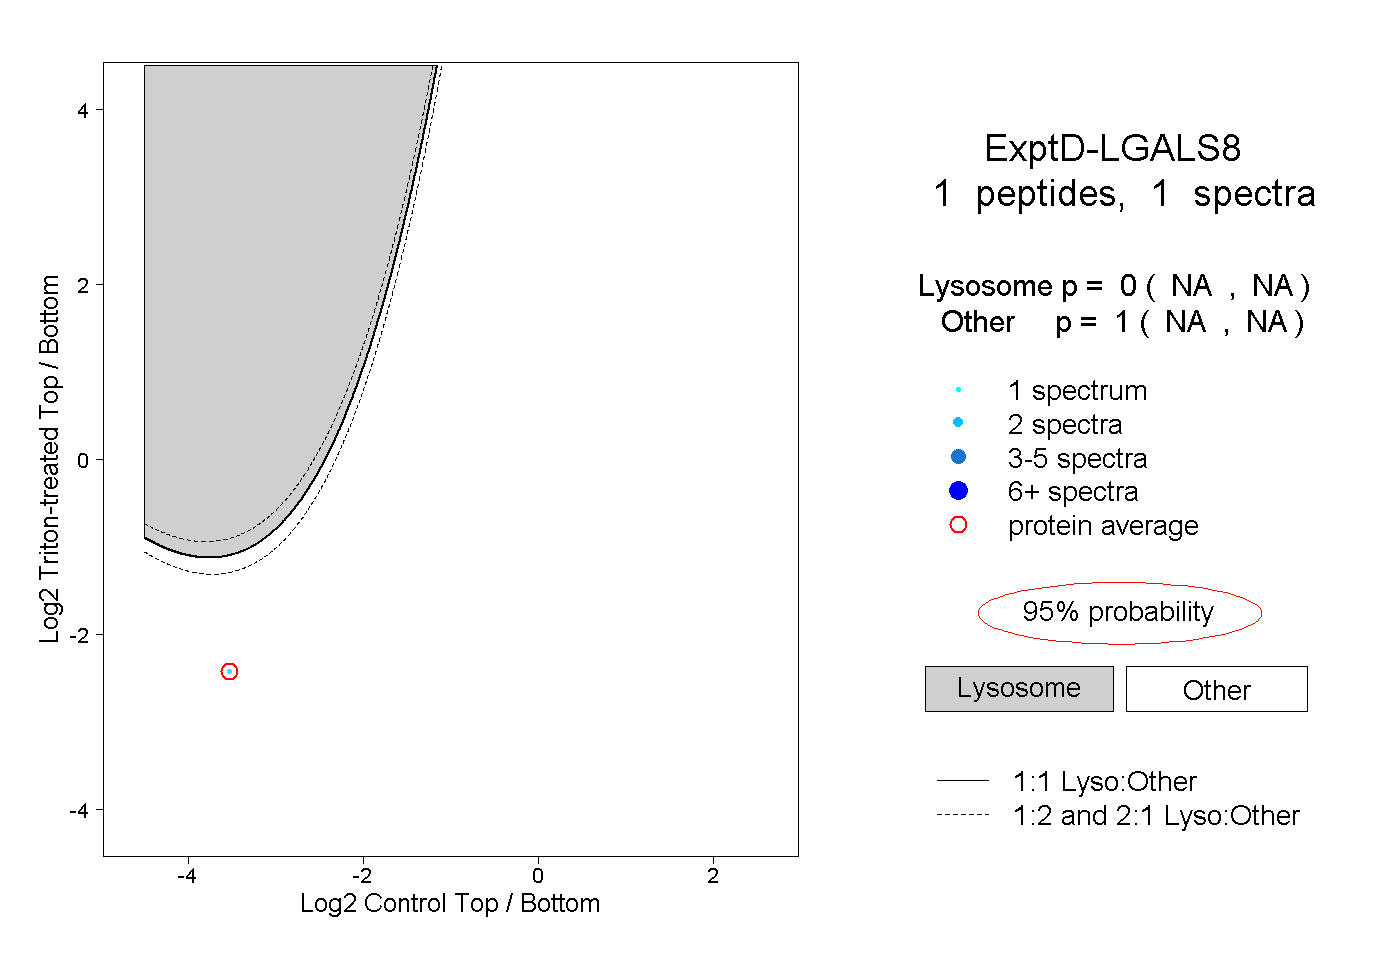
NA | NA
NA | NA