 13
13peptides
spectra
0.000 | 0.000
0.216 | 0.246
0.006 | 0.041
0.000 | 0.000
0.113 | 0.151
0.363 | 0.406
0.215 | 0.229
0.000 | 0.000
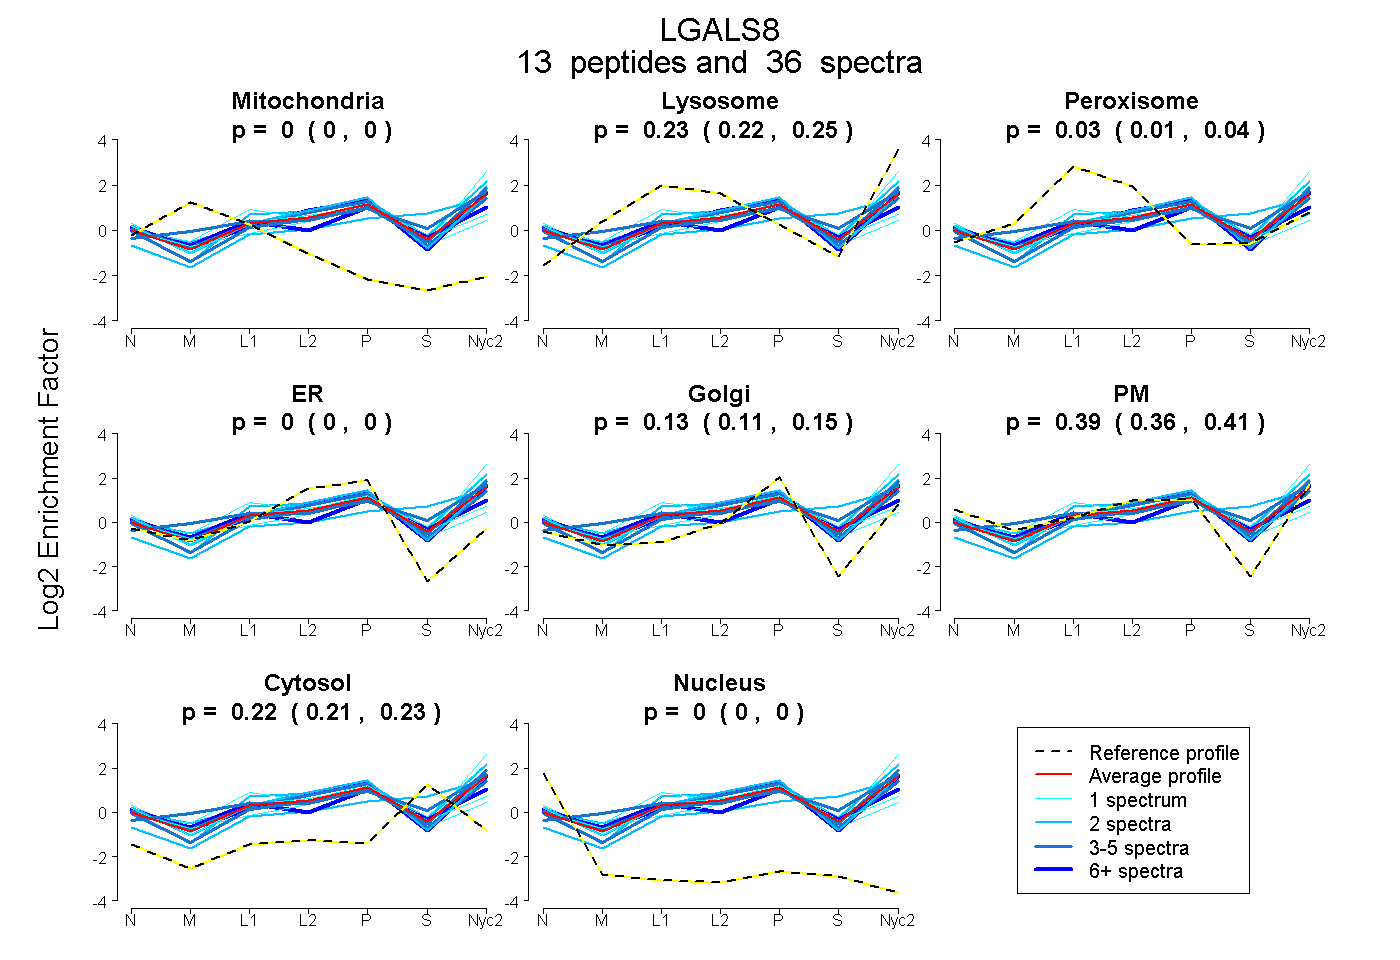
| Plot | Mito | Lyso | Perox | ER | Golgi | PM | Cytosol | Nucleus | |||||
| Expt A |
13 peptides |
36 spectra |
|
0.000 0.000 | 0.000 |
0.233 0.216 | 0.246 |
0.025 0.006 | 0.041 |
0.000 0.000 | 0.000 |
0.133 0.113 | 0.151 |
0.387 0.363 | 0.406 |
0.223 0.215 | 0.229 |
0.000 0.000 | 0.000 |
| 1 spectrum, SNCIVCNTLTNEK | 0.000 | 0.000 | 0.205 | 0.000 | 0.376 | 0.198 | 0.220 | 0.000 | ||
| 7 spectra, LNASMGPGR | 0.000 | 0.174 | 0.026 | 0.000 | 0.140 | 0.513 | 0.147 | 0.000 | ||
| 1 spectrum, GEVNTNAK | 0.000 | 0.456 | 0.000 | 0.000 | 0.103 | 0.326 | 0.115 | 0.000 | ||
| 4 spectra, VNIHSIGFR | 0.000 | 0.252 | 0.000 | 0.000 | 0.040 | 0.381 | 0.326 | 0.000 | ||
| 3 spectra, NSFLQDAWGEEER | 0.000 | 0.139 | 0.118 | 0.000 | 0.243 | 0.352 | 0.148 | 0.000 | ||
| 2 spectra, SFNVDLVAGR | 0.000 | 0.157 | 0.029 | 0.026 | 0.142 | 0.503 | 0.143 | 0.000 | ||
| 2 spectra, FQVDFQHGNSLKPR | 0.000 | 0.335 | 0.000 | 0.000 | 0.068 | 0.401 | 0.197 | 0.000 | ||
| 1 spectrum, VAVNGVHSLEYK | 0.000 | 0.293 | 0.000 | 0.000 | 0.000 | 0.478 | 0.230 | 0.000 | ||
| 2 spectra, HILLYAHR | 0.000 | 0.343 | 0.000 | 0.000 | 0.144 | 0.031 | 0.482 | 0.000 | ||
| 2 spectra, ADVAFHFNPR | 0.000 | 0.266 | 0.000 | 0.000 | 0.163 | 0.453 | 0.118 | 0.000 | ||
| 1 spectrum, FSSDLQSMETSTLGLTQISK | 0.000 | 0.000 | 0.198 | 0.154 | 0.203 | 0.253 | 0.192 | 0.000 | ||
| 4 spectra, WGWEEITHDMPFR | 0.000 | 0.384 | 0.018 | 0.000 | 0.192 | 0.233 | 0.173 | 0.000 | ||
| 6 spectra, LHLSLPFEAR | 0.000 | 0.081 | 0.201 | 0.000 | 0.280 | 0.208 | 0.230 | 0.000 |
| Plot | Mito | Lyso or Perox | ER | Golgi | PM | Cytosol | Nucleus | ||||||
| Expt B |
3 peptides |
5 spectra |
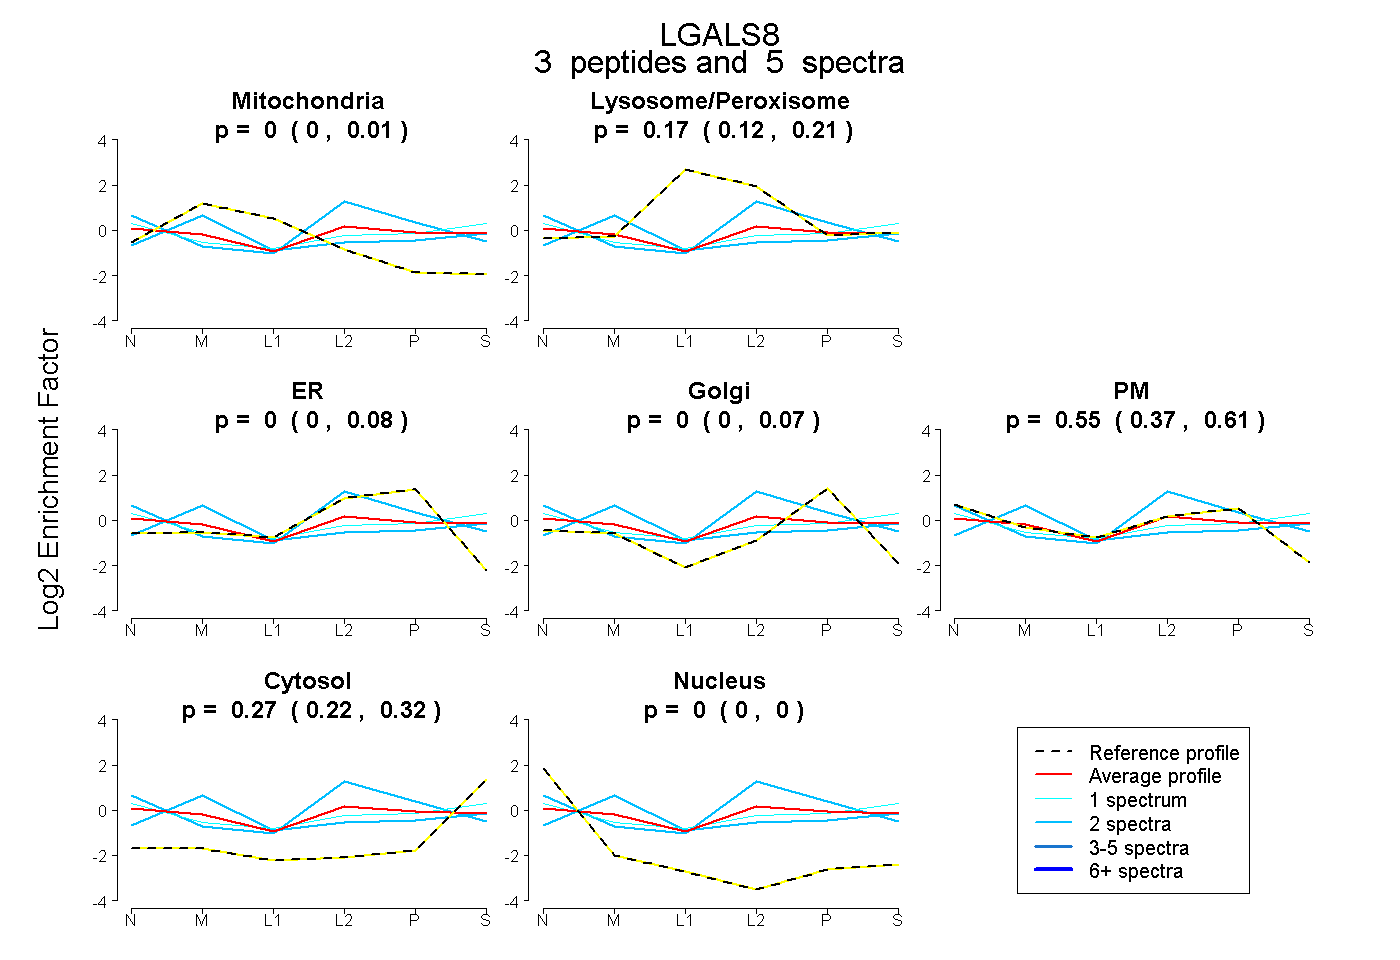 |
0.000 0.000 | 0.010 |
0.172 0.120 | 0.213 |
0.000 0.000 | 0.085 |
0.000 0.000 | 0.069 |
0.554 0.368 | 0.605 |
0.275 0.220 | 0.319 |
0.000 0.000 | 0.000 |
|||
| Plot | Lyso | Other | |||||||||||
| Expt C |
10 peptides |
25 spectra |
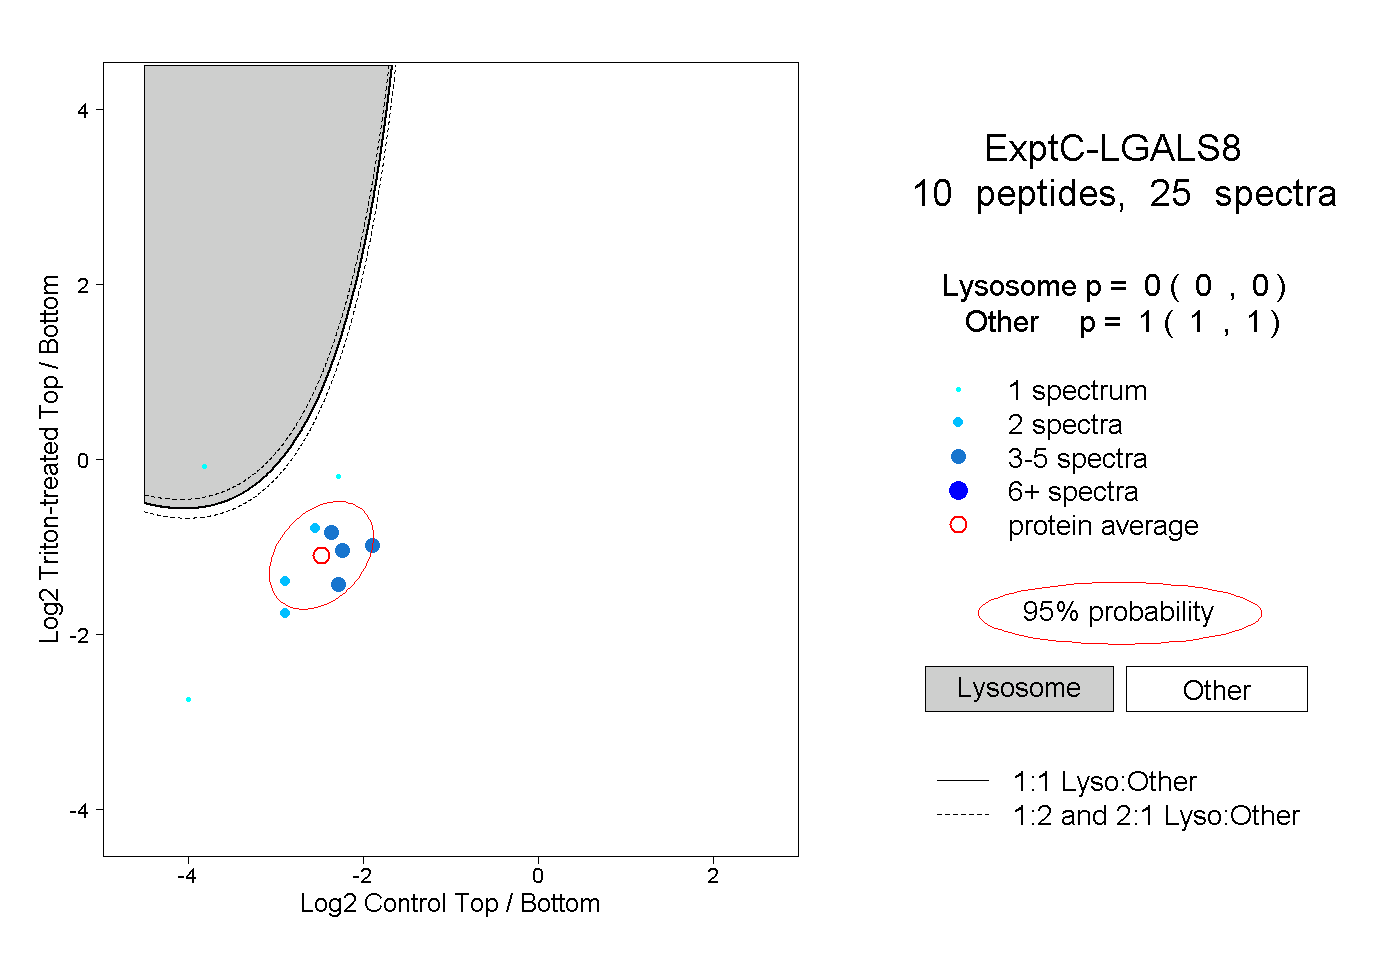 |
0.000 0.000 | 0.000 |
1.000 1.000 | 1.000 |
||||||||
| Plot | Lyso | Other | |||||||||||
| Expt D |
1 peptide |
1 spectrum |
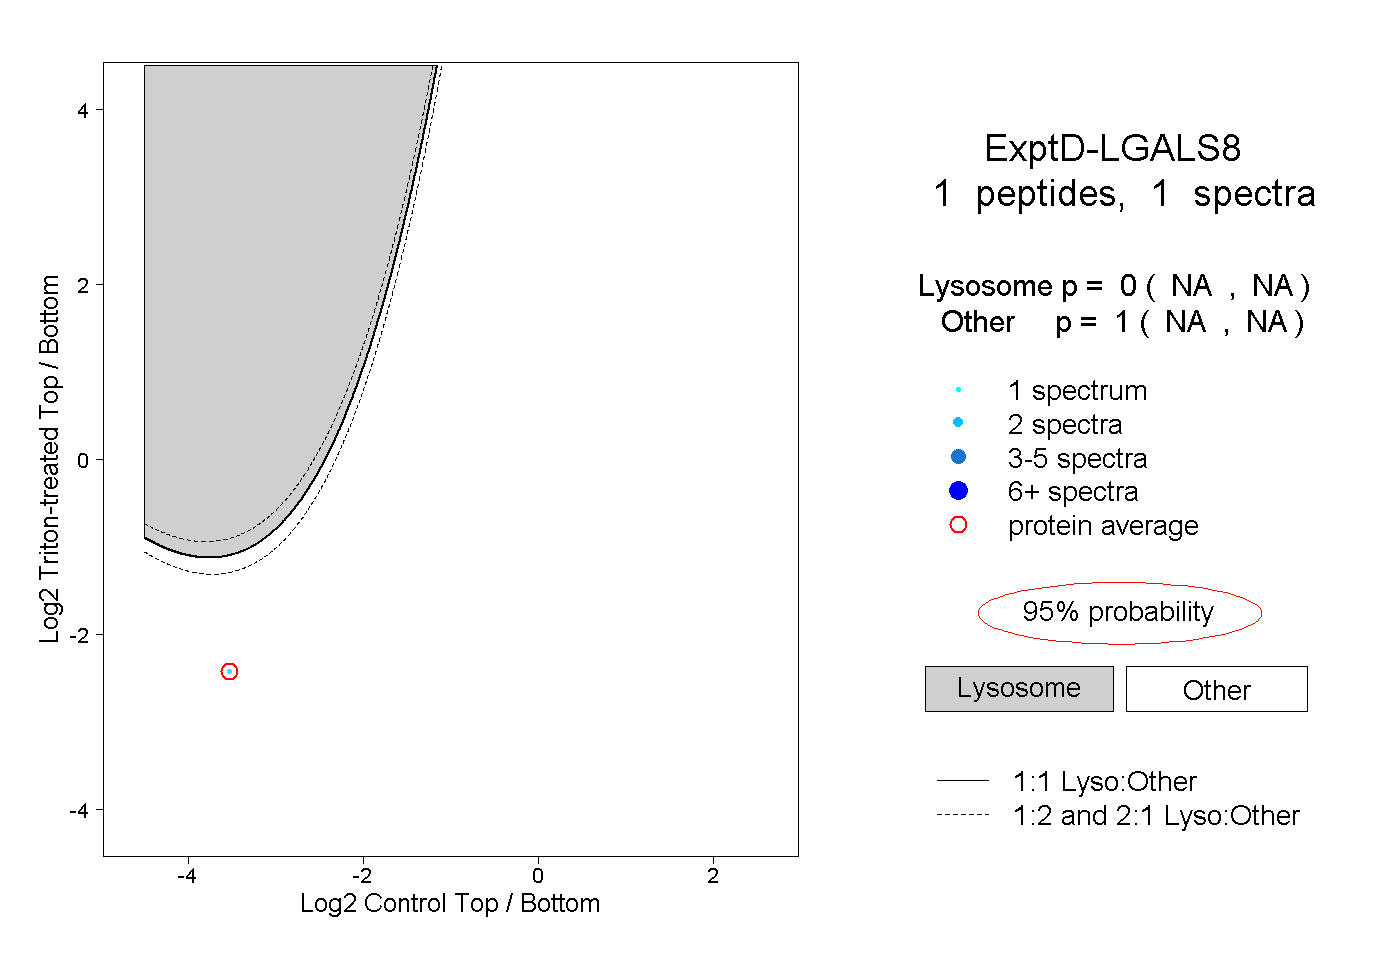 |
0.000 NA | NA |
1.000 NA | NA |