 3
3peptides
spectra
0.000 | 0.000
0.000 | 0.000
0.000 | 0.045
0.112 | 0.262
0.000 | 0.022
0.217 | 0.375
0.443 | 0.519
0.000 | 0.003
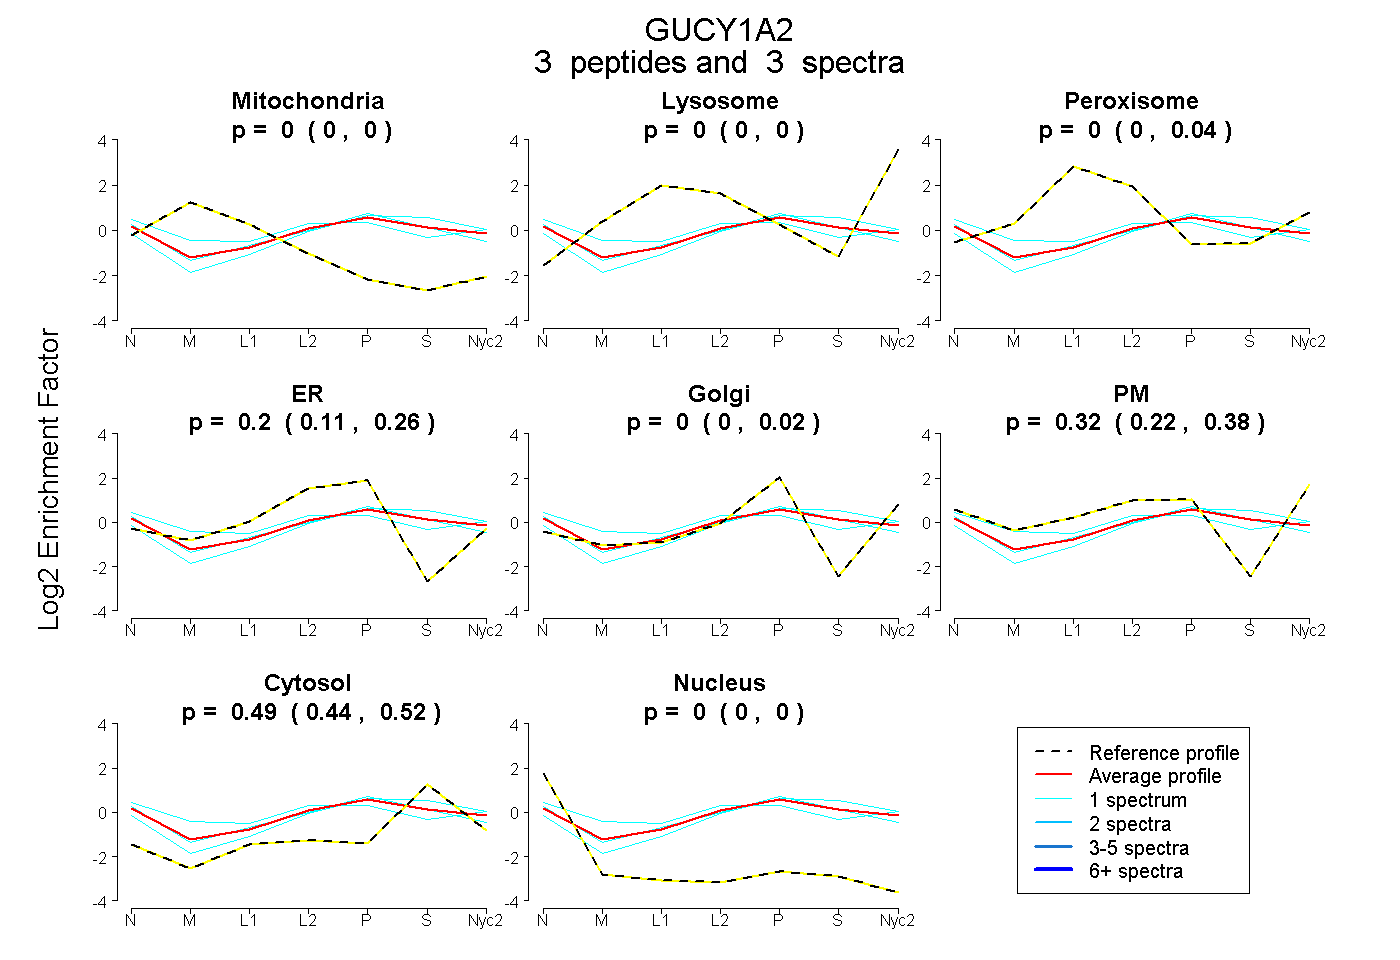
| Plot | Mito | Lyso | Perox | ER | Golgi | PM | Cytosol | Nucleus | |||||
| Expt A |
3 peptides |
3 spectra |
|
0.000 0.000 | 0.000 |
0.000 0.000 | 0.000 |
0.000 0.000 | 0.045 |
0.196 0.112 | 0.262 |
0.000 0.000 | 0.022 |
0.316 0.217 | 0.375 |
0.488 0.443 | 0.519 |
0.000 0.000 | 0.003 |