 3
3peptides
spectra
0.000 | 0.000
0.000 | 0.000
0.000 | 0.045
0.112 | 0.262
0.000 | 0.022
0.217 | 0.375
0.443 | 0.519
0.000 | 0.003
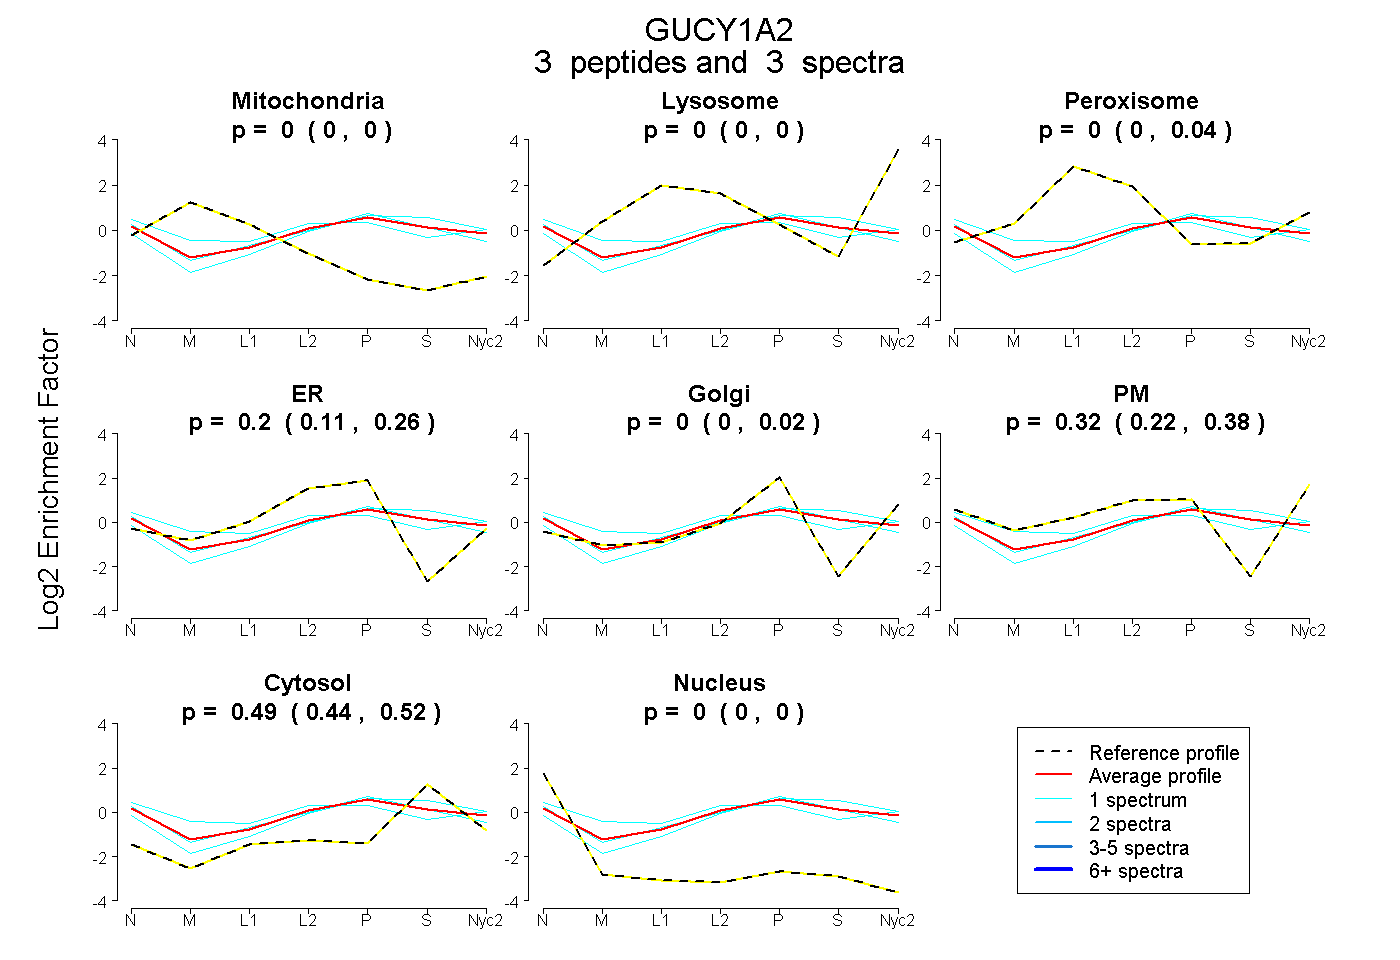
| Plot | Mito | Lyso | Perox | ER | Golgi | PM | Cytosol | Nucleus | |||||
| Expt A |
3 peptides |
3 spectra |
|
0.000 0.000 | 0.000 |
0.000 0.000 | 0.000 |
0.000 0.000 | 0.045 |
0.196 0.112 | 0.262 |
0.000 0.000 | 0.022 |
0.316 0.217 | 0.375 |
0.488 0.443 | 0.519 |
0.000 0.000 | 0.003 |
| 1 spectrum, ISINTFCR | 0.000 | 0.000 | 0.000 | 0.317 | 0.000 | 0.189 | 0.494 | 0.000 | ||
| 1 spectrum, FGEEFFK | 0.000 | 0.000 | 0.000 | 0.098 | 0.143 | 0.196 | 0.563 | 0.000 | ||
| 1 spectrum, THQALEEEK | 0.057 | 0.000 | 0.069 | 0.085 | 0.000 | 0.437 | 0.351 | 0.000 |