 12
12peptides
spectra
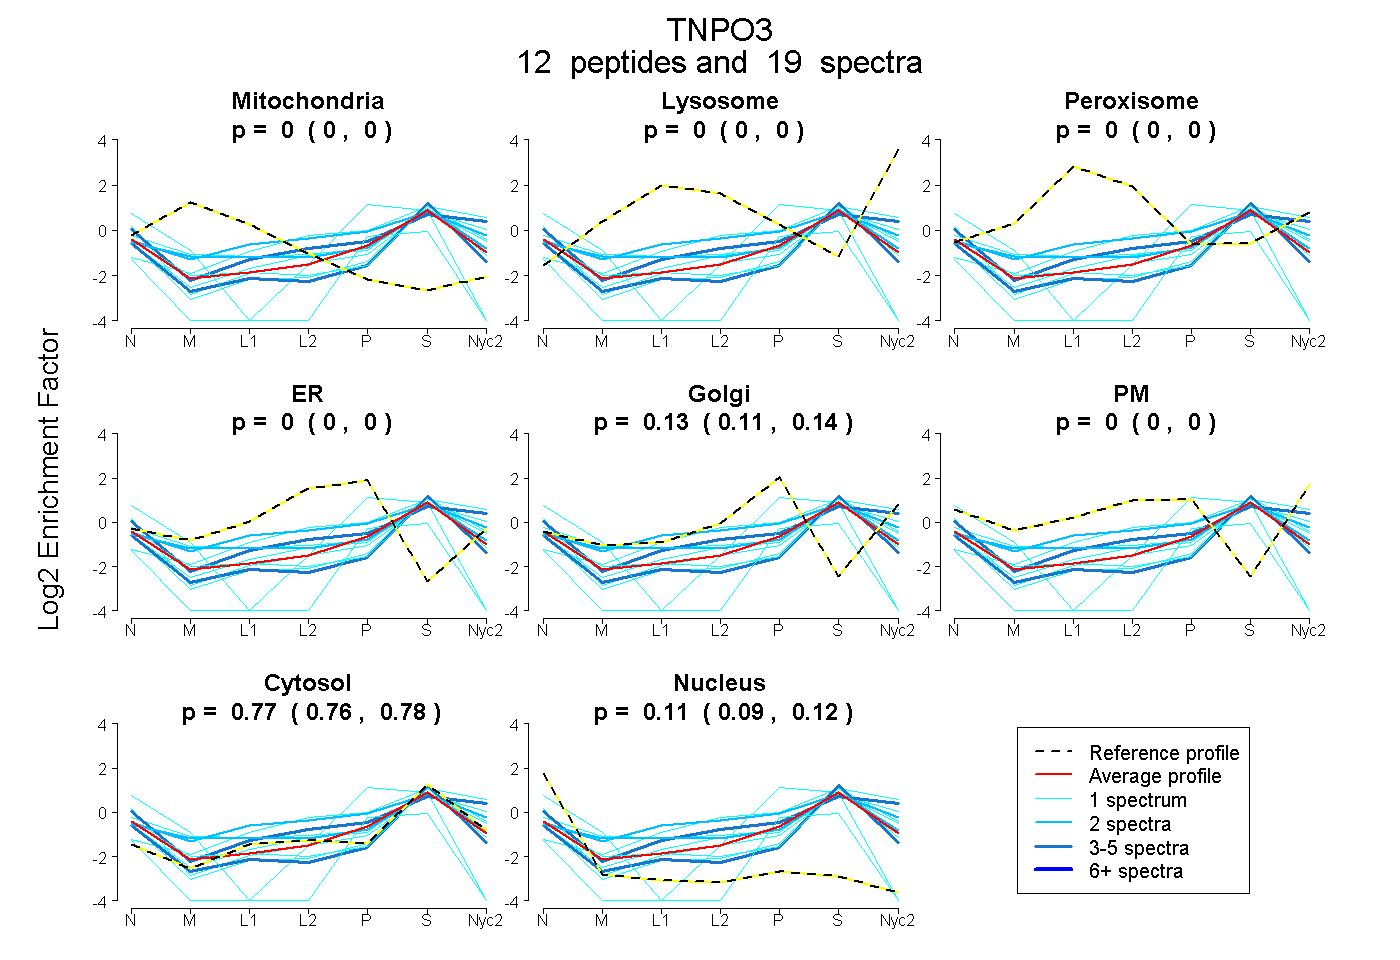
0.000 | 0.000
0.000 | 0.000
0.000 | 0.000
0.000 | 0.000
0.108 | 0.142
0.000 | 0.000
0.755 | 0.779
0.087 | 0.120
2peptides
spectra
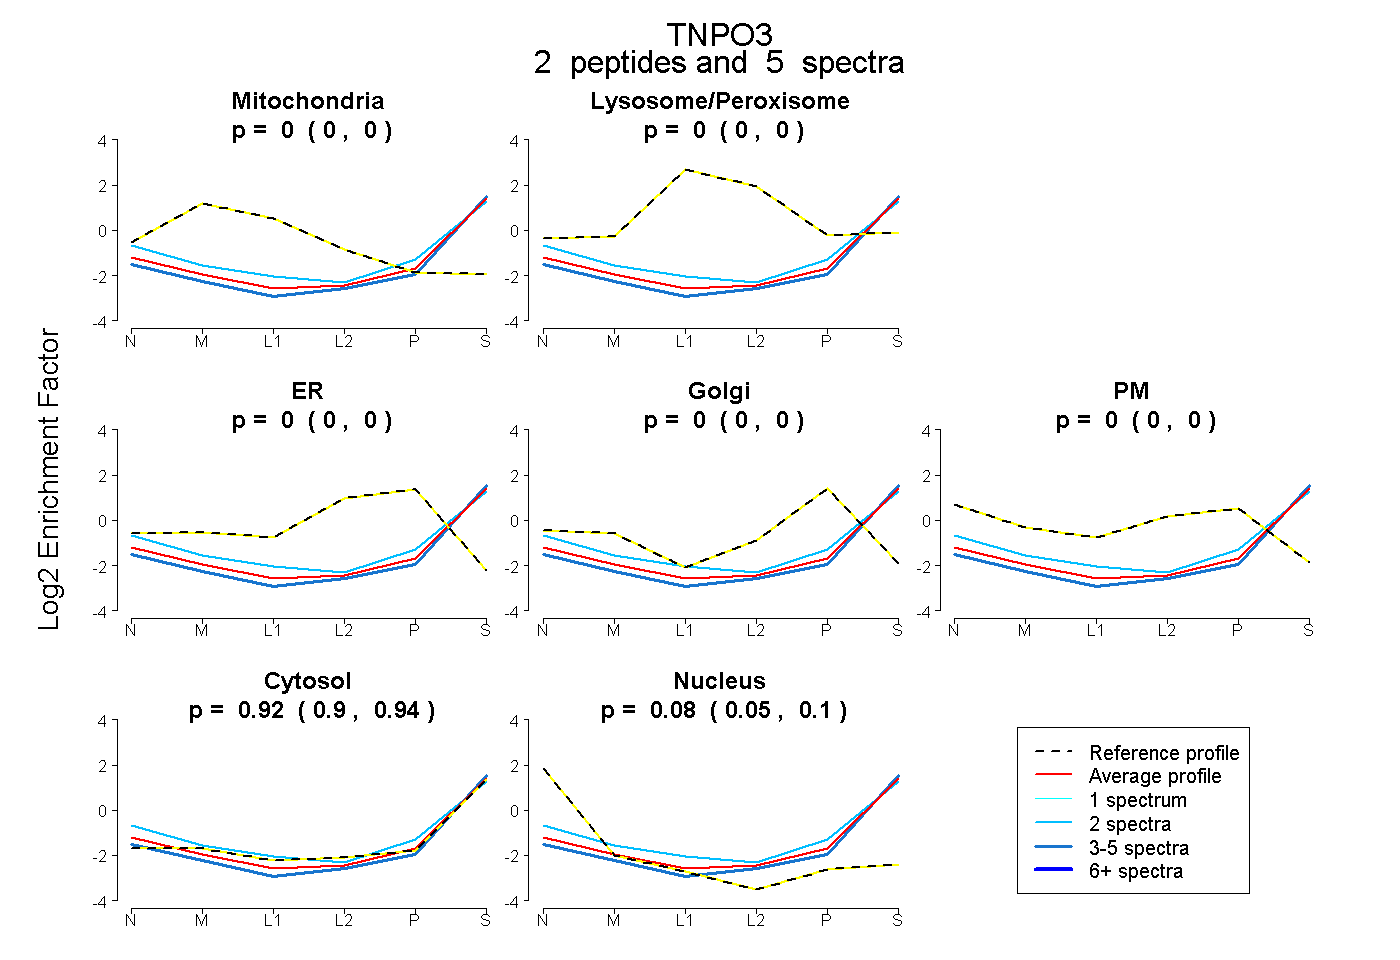
0.000 | 0.000
0.000 | 0.000
0.000 | 0.000
0.000 | 0.000
0.000 | 0.000
0.898 | 0.942
0.054 | 0.098
5peptides
spectra
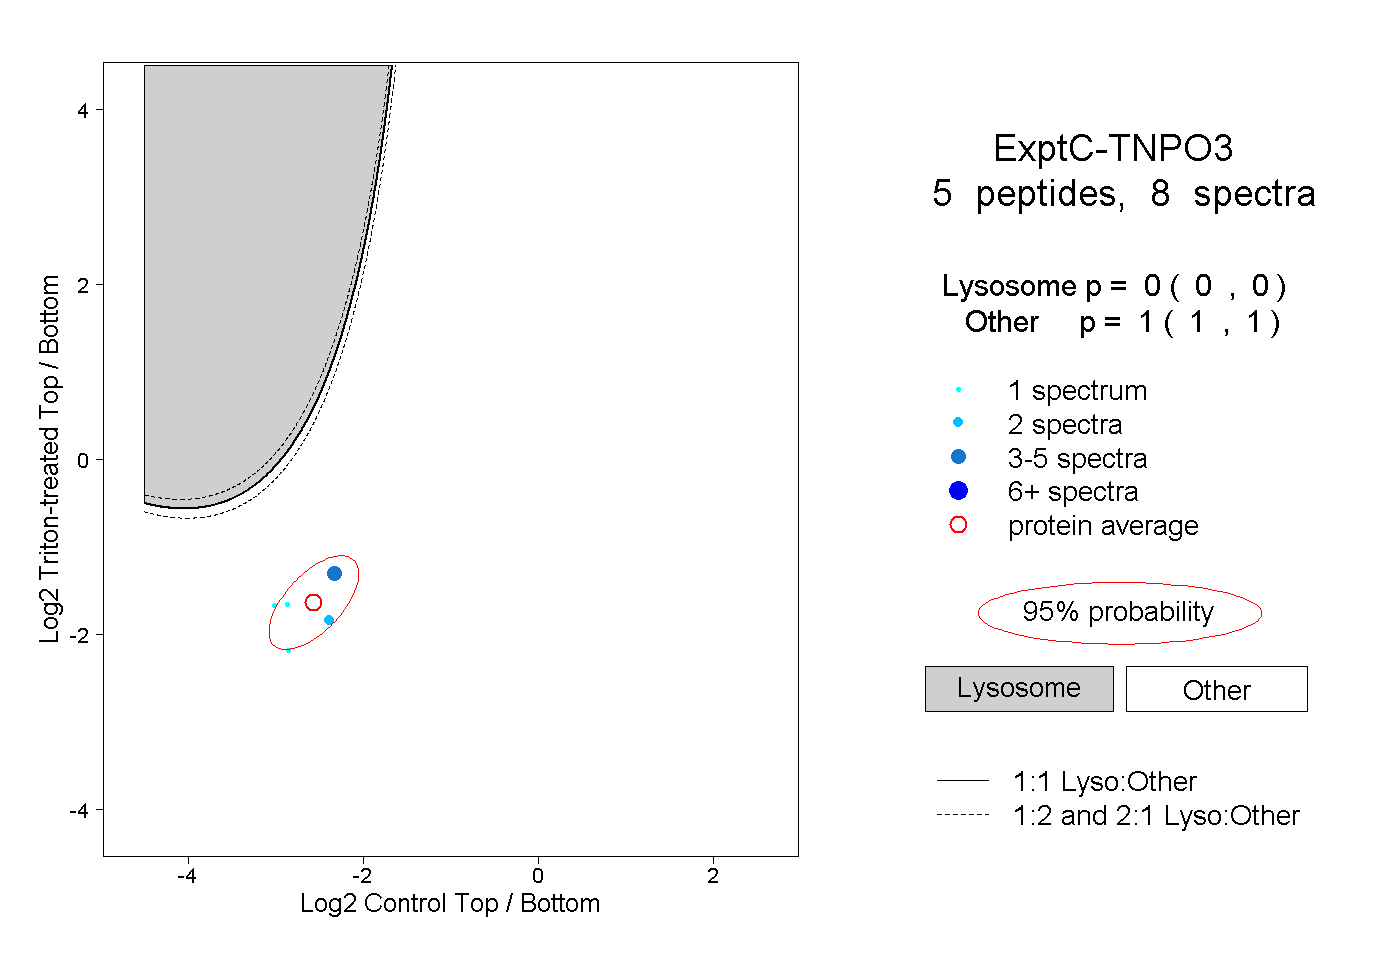
0.000 | 0.000
1.000 | 1.000