 12
12peptides
spectra
0.000 | 0.000
0.000 | 0.000
0.000 | 0.000
0.000 | 0.000
0.108 | 0.142
0.000 | 0.000
0.755 | 0.779
0.087 | 0.120
| Plot | Mito | Lyso | Perox | ER | Golgi | PM | Cytosol | Nucleus | |||||
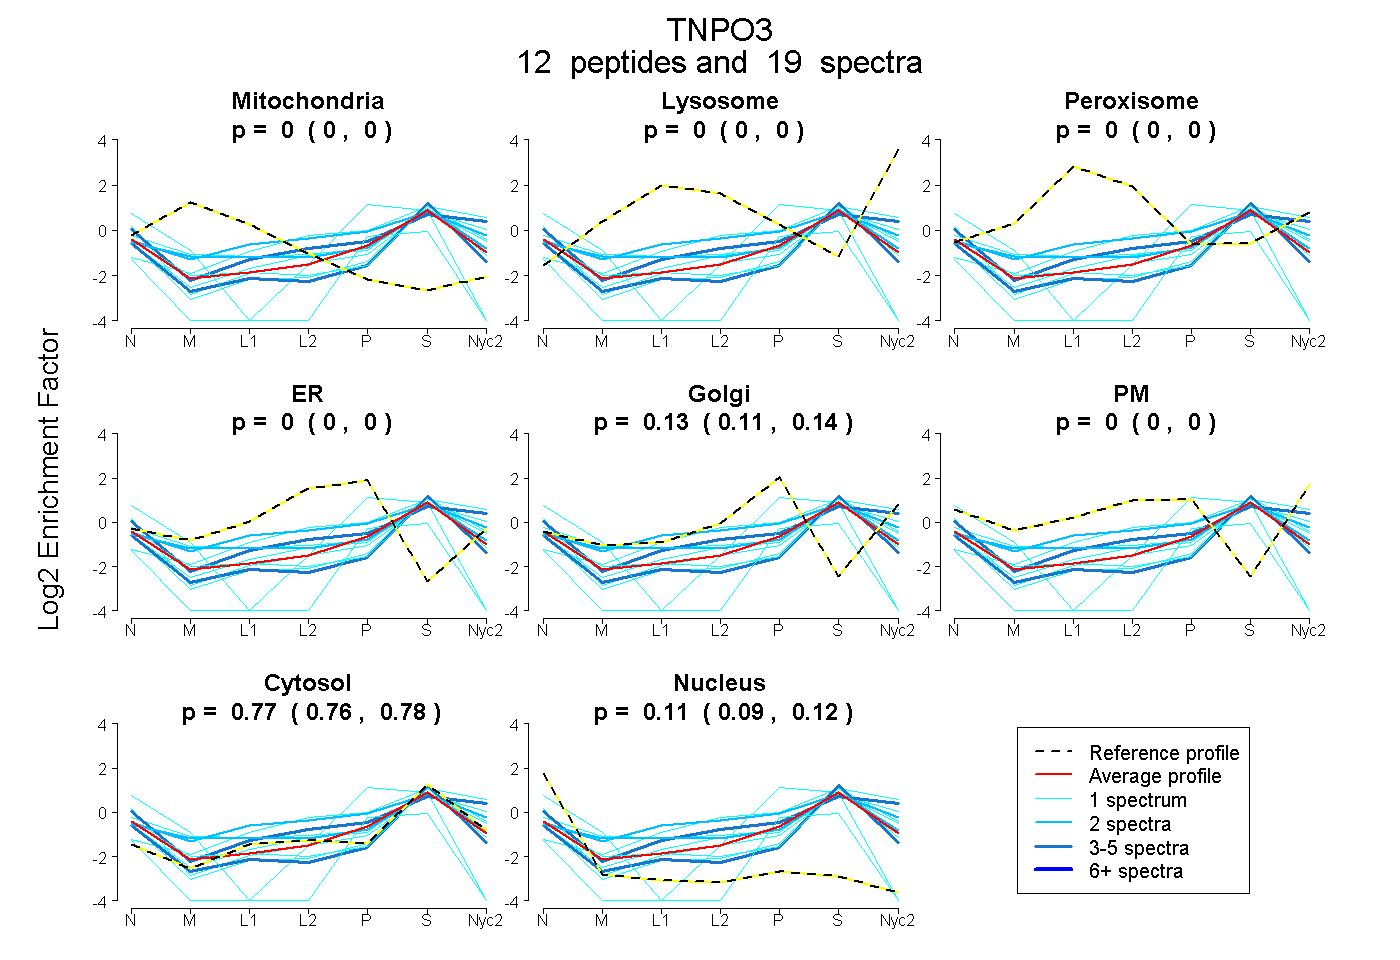
| Expt A |
12 peptides |
19 spectra |
|
0.000 0.000 | 0.000 |
0.000 0.000 | 0.000 |
0.000 0.000 | 0.000 |
0.000 0.000 | 0.000 |
0.127 0.108 | 0.142 |
0.000 0.000 | 0.000 |
0.768 0.755 | 0.779 |
0.105 0.087 | 0.120 |
| 1 spectrum, GTALVLAR | 0.000 | 0.000 | 0.000 | 0.000 | 0.000 | 0.000 | 0.850 | 0.150 | ||
| 1 spectrum, VIQEIWPVLSETLNK | 0.000 | 0.000 | 0.000 | 0.000 | 0.000 | 0.000 | 0.334 | 0.666 | ||
| 1 spectrum, ASFWLGELQR | 0.000 | 0.000 | 0.000 | 0.000 | 0.012 | 0.094 | 0.866 | 0.028 | ||
| 3 spectra, QVCWALR | 0.000 | 0.000 | 0.000 | 0.000 | 0.000 | 0.289 | 0.711 | 0.000 | ||
| 4 spectra, LLHALAR | 0.000 | 0.000 | 0.000 | 0.000 | 0.000 | 0.000 | 0.821 | 0.179 | ||
| 1 spectrum, DLIHTGVANDHEEDFEVR | 0.000 | 0.000 | 0.000 | 0.000 | 0.000 | 0.000 | 0.705 | 0.295 | ||
| 1 spectrum, IFTELCETFLEK | 0.000 | 0.211 | 0.000 | 0.000 | 0.116 | 0.000 | 0.673 | 0.000 | ||
| 1 spectrum, SPVTLLR | 0.015 | 0.000 | 0.000 | 0.000 | 0.000 | 0.000 | 0.835 | 0.150 | ||
| 1 spectrum, ETTVGAVTVTHK | 0.054 | 0.012 | 0.000 | 0.000 | 0.000 | 0.235 | 0.699 | 0.000 | ||
| 1 spectrum, DANSSVMR | 0.000 | 0.000 | 0.000 | 0.000 | 0.000 | 0.087 | 0.772 | 0.140 | ||
| 2 spectra, QLTDFHK | 0.000 | 0.000 | 0.161 | 0.000 | 0.128 | 0.104 | 0.607 | 0.000 | ||
| 2 spectra, VSDLVK | 0.132 | 0.000 | 0.000 | 0.000 | 0.021 | 0.103 | 0.745 | 0.000 |
| Plot | Mito | Lyso or Perox | ER | Golgi | PM | Cytosol | Nucleus | ||||||
| Expt B |
2 peptides |
5 spectra |
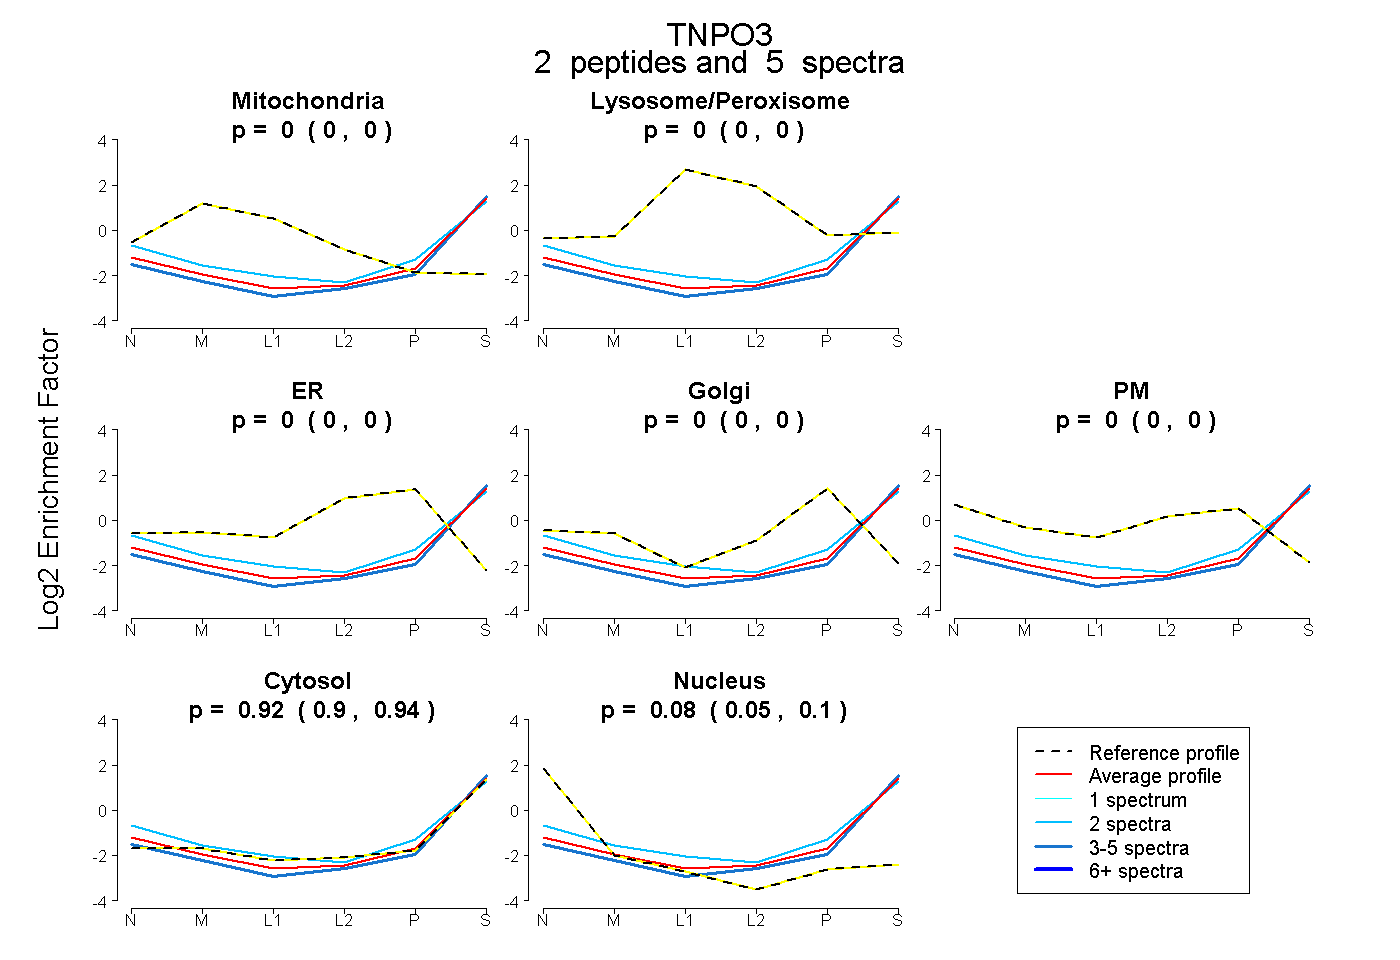 |
0.000 0.000 | 0.000 |
0.000 0.000 | 0.000 |
0.000 0.000 | 0.000 |
0.000 0.000 | 0.000 |
0.000 0.000 | 0.000 |
0.922 0.898 | 0.942 |
0.078 0.054 | 0.098 |
|||
| Plot | Lyso | Other | |||||||||||
| Expt C |
5 peptides |
8 spectra |
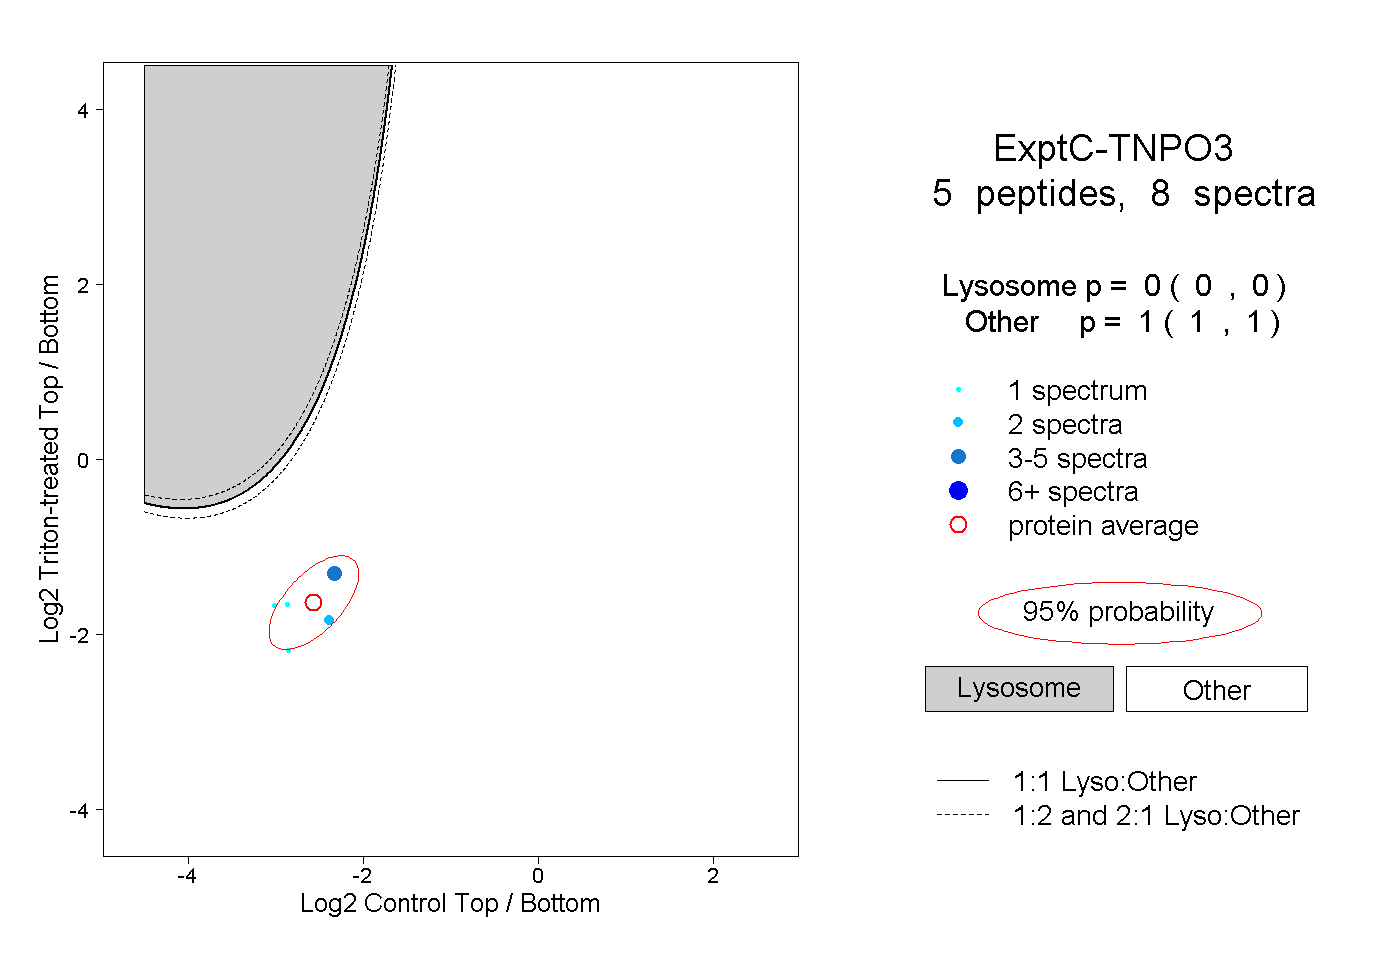 |
0.000 0.000 | 0.000 |
1.000 1.000 | 1.000 |