 5
5peptides
spectra
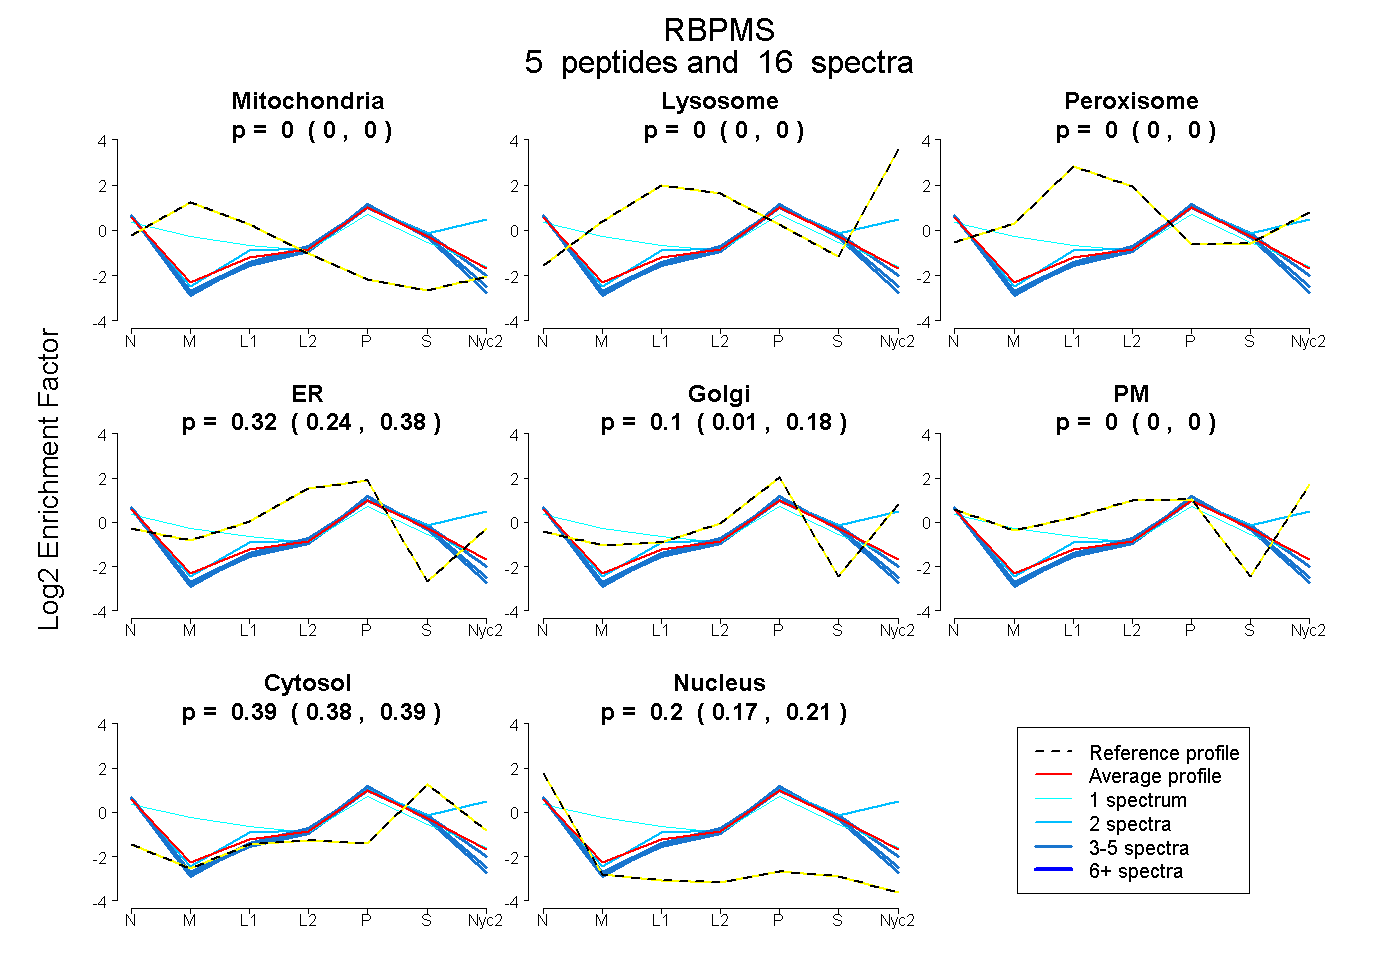
0.000 | 0.000
0.000 | 0.000
0.000 | 0.000
0.243 | 0.381
0.006 | 0.179
0.000 | 0.000
0.376 | 0.395
0.174 | 0.214
7peptides
spectra
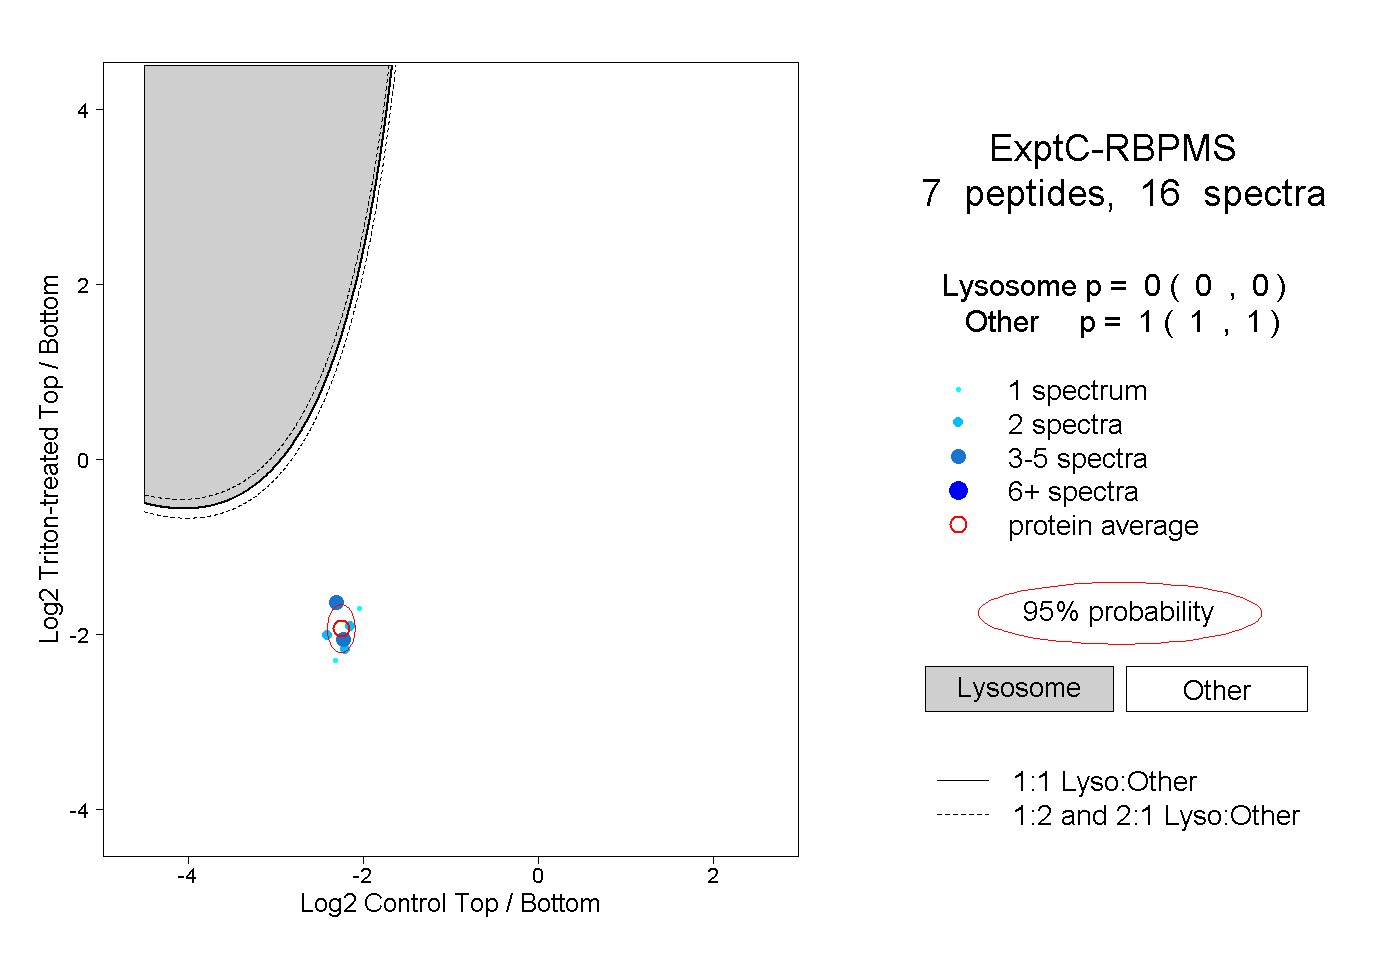
0.000 | 0.000
1.000 | 1.000
1peptide
spectrum
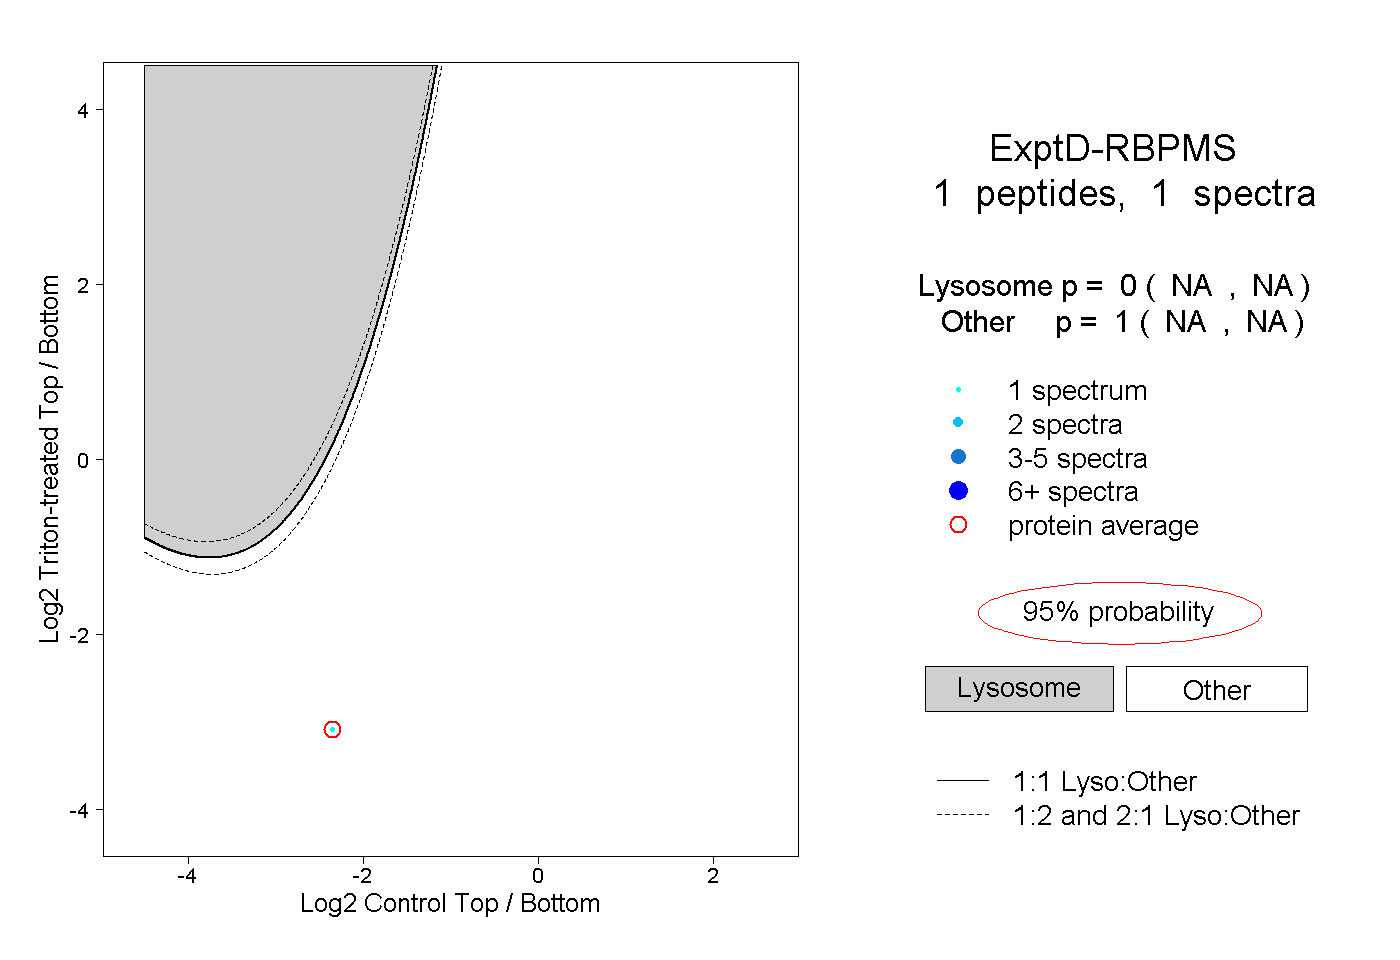
NA | NA
NA | NA