 5
5peptides
spectra
0.000 | 0.000
0.000 | 0.000
0.000 | 0.000
0.243 | 0.381
0.006 | 0.179
0.000 | 0.000
0.376 | 0.395
0.174 | 0.214
| Plot | Mito | Lyso | Perox | ER | Golgi | PM | Cytosol | Nucleus | |||||
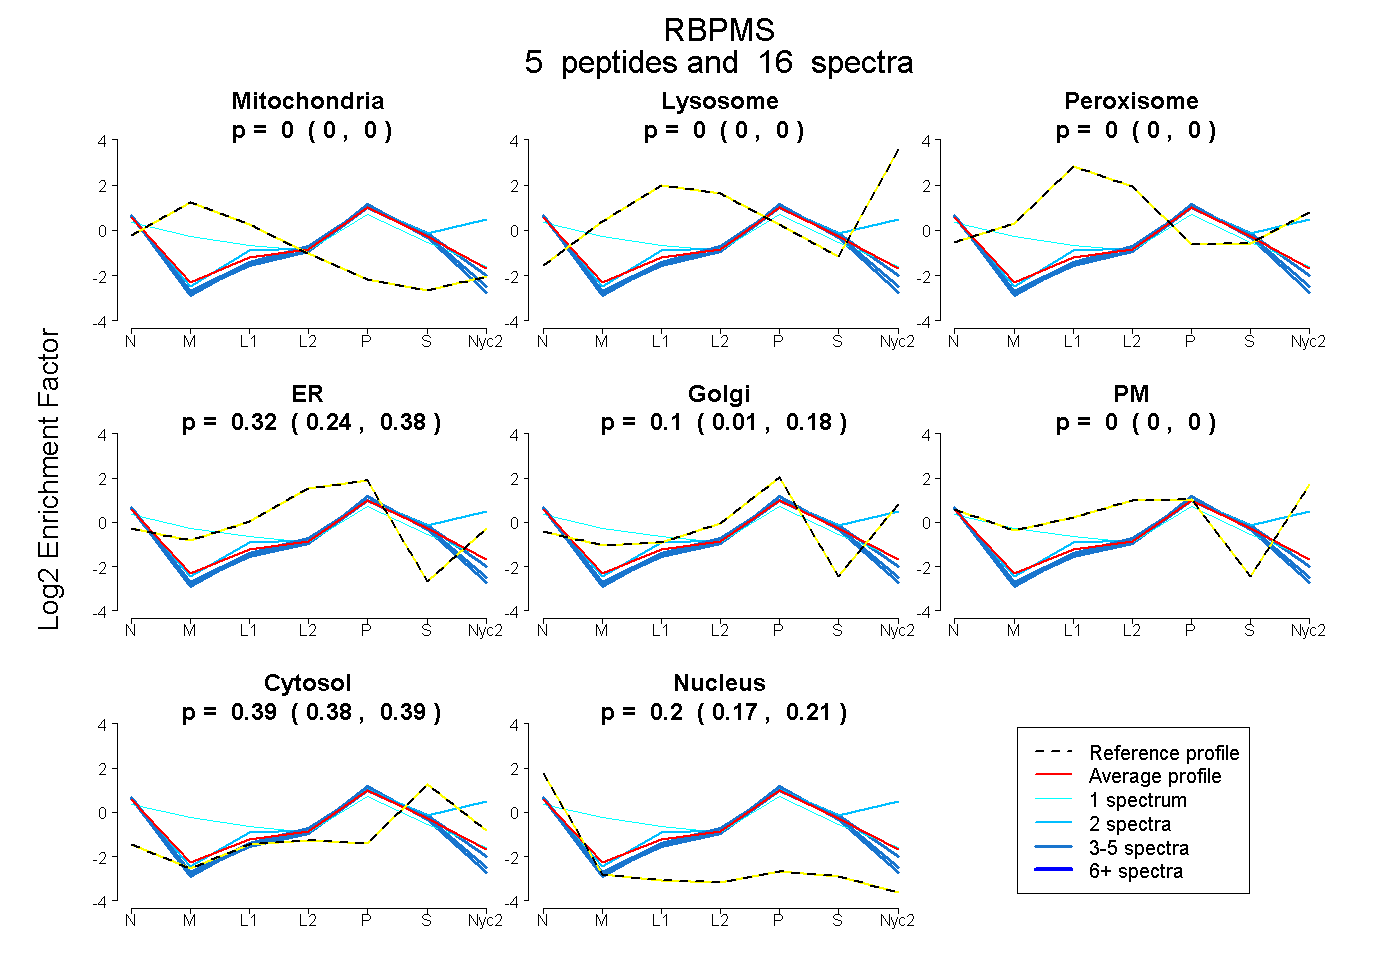
| Expt A |
5 peptides |
16 spectra |
|
0.000 0.000 | 0.000 |
0.000 0.000 | 0.000 |
0.000 0.000 | 0.000 |
0.320 0.243 | 0.381 |
0.098 0.006 | 0.179 |
0.000 0.000 | 0.000 |
0.386 0.376 | 0.395 |
0.196 0.174 | 0.214 |
| 1 spectrum, GYEGSLIK | 0.236 | 0.000 | 0.000 | 0.242 | 0.173 | 0.000 | 0.282 | 0.067 | ||
| 5 spectra, ELYLLFRPFK | 0.000 | 0.000 | 0.000 | 0.356 | 0.000 | 0.000 | 0.352 | 0.291 | ||
| 5 spectra, TLFVSGLPLDIKPR | 0.000 | 0.000 | 0.000 | 0.362 | 0.000 | 0.000 | 0.374 | 0.263 | ||
| 2 spectra, QPVGFVSFDSR | 0.000 | 0.000 | 0.000 | 0.000 | 0.392 | 0.157 | 0.435 | 0.016 | ||
| 3 spectra, FDPEIPQTLR | 0.000 | 0.000 | 0.000 | 0.280 | 0.073 | 0.000 | 0.411 | 0.236 |
| Plot | Lyso | Other | |||||||||||
| Expt C |
7 peptides |
16 spectra |
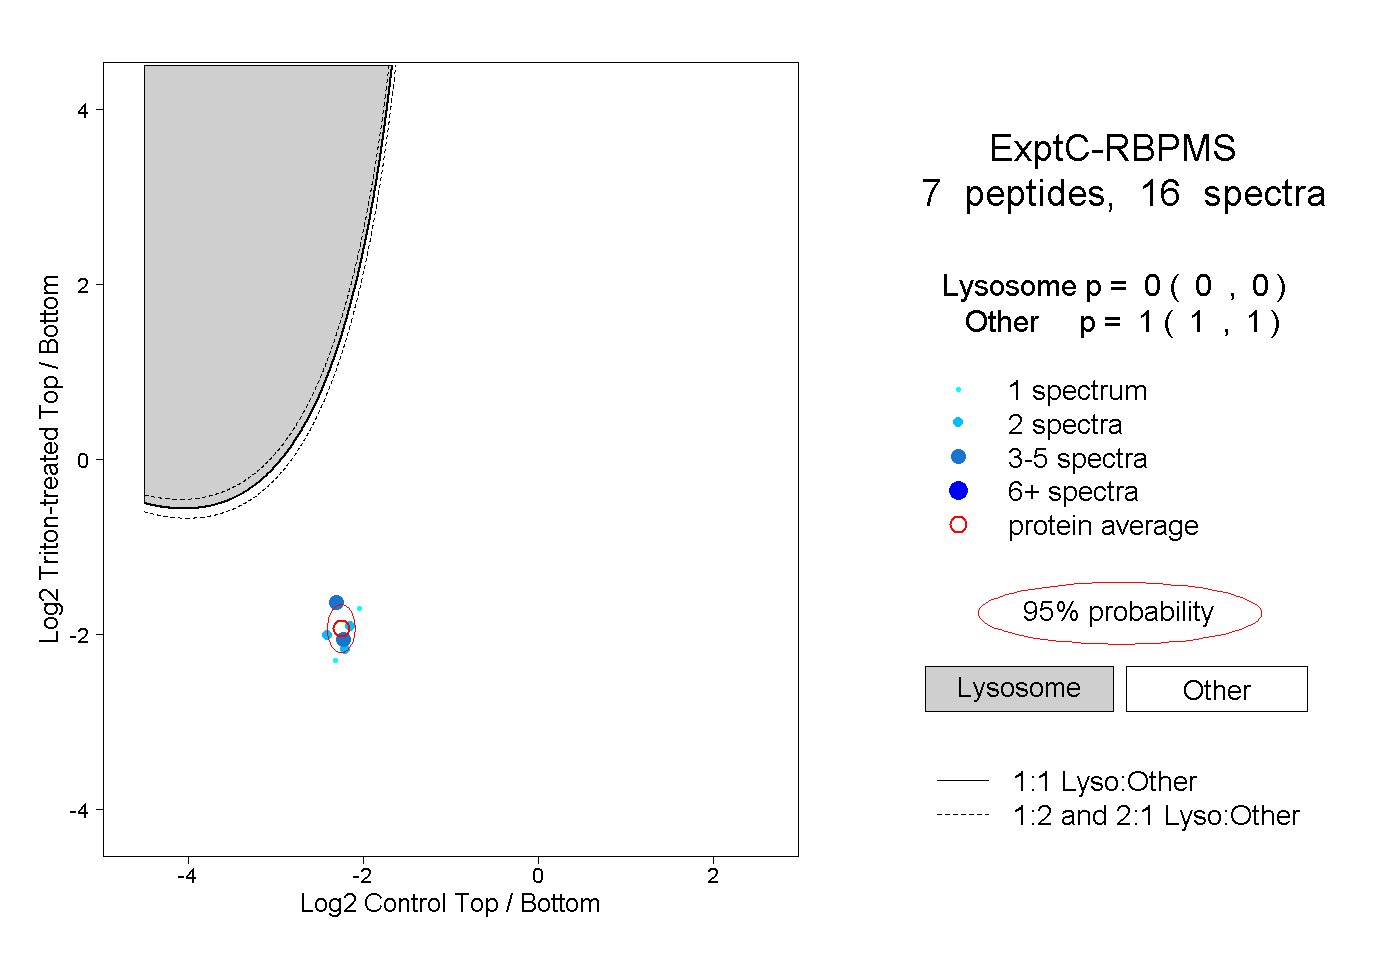 |
0.000 0.000 | 0.000 |
1.000 1.000 | 1.000 |
||||||||
| Plot | Lyso | Other | |||||||||||
| Expt D |
1 peptide |
1 spectrum |
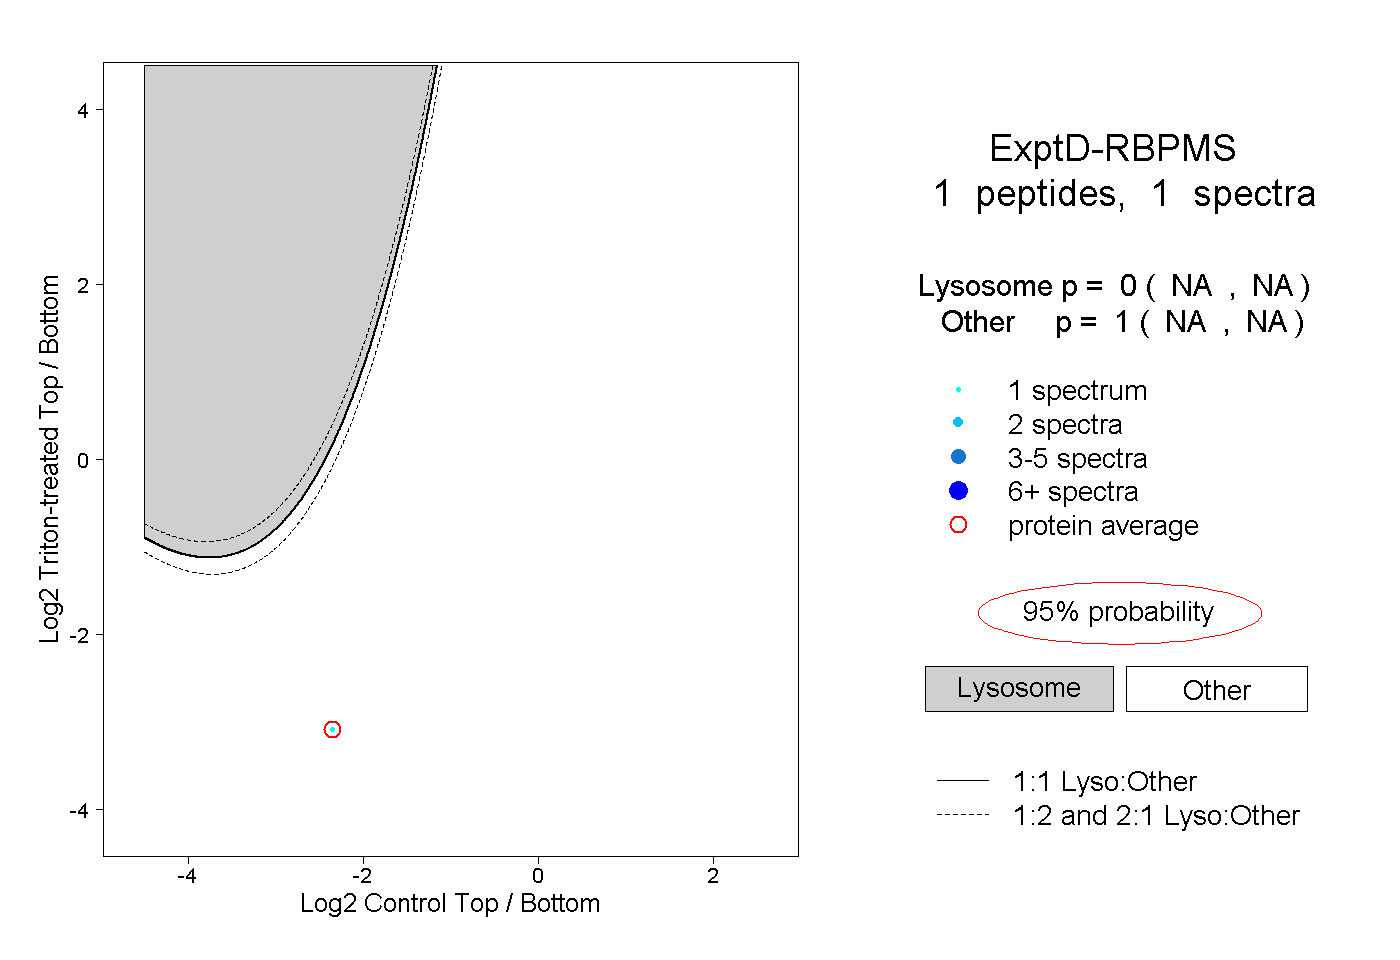 |
0.000 NA | NA |
1.000 NA | NA |