 2
2peptides
spectra
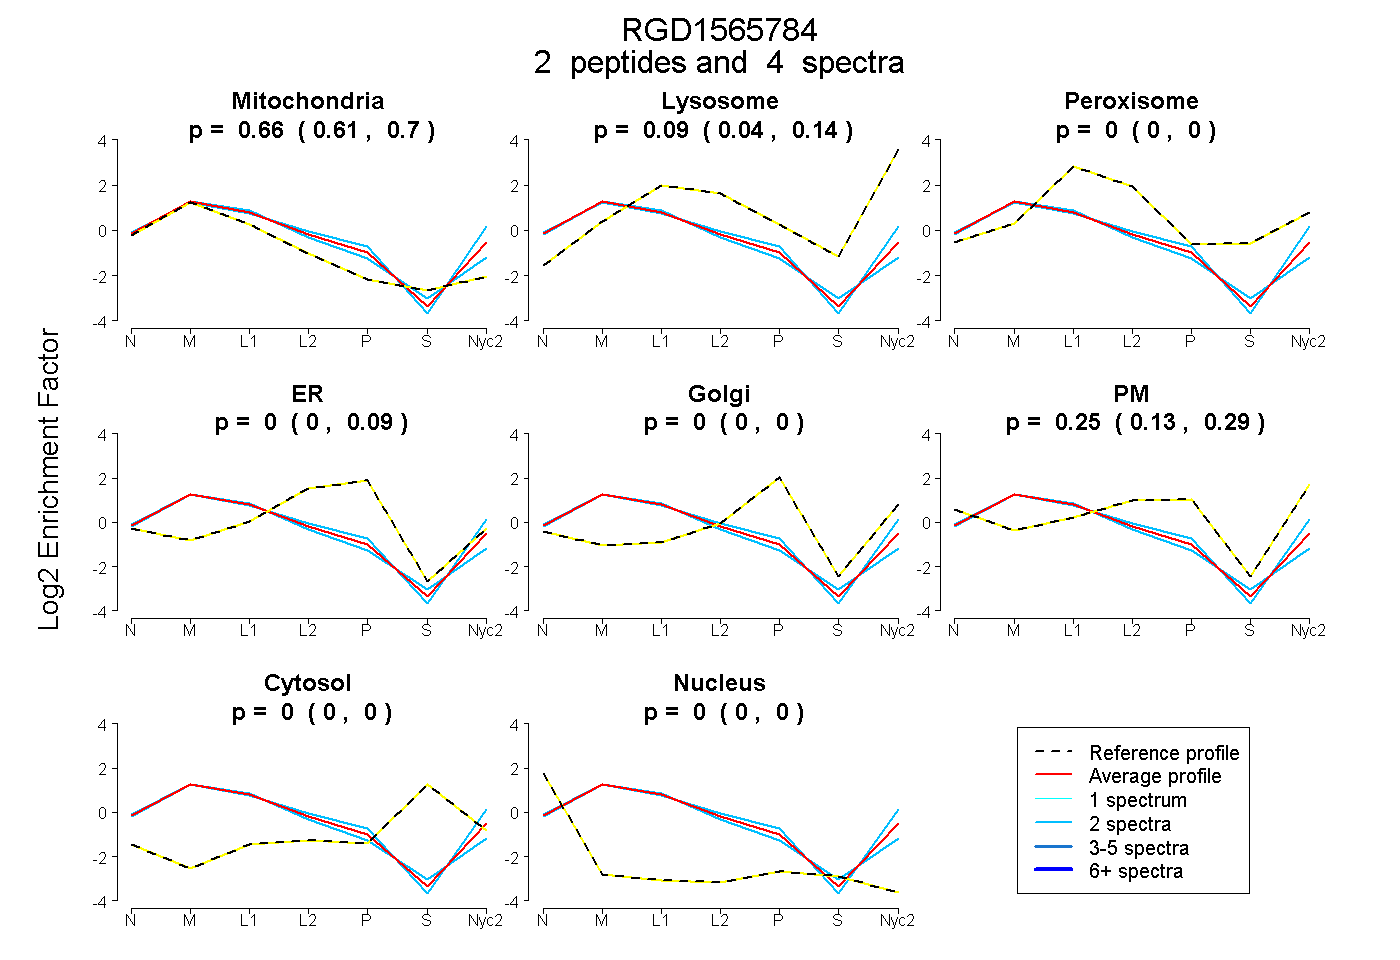
0.606 | 0.698
0.037 | 0.142
0.000 | 0.000
0.000 | 0.088
0.000 | 0.000
0.131 | 0.290
0.000 | 0.000
0.000 | 0.000
3peptides
spectra
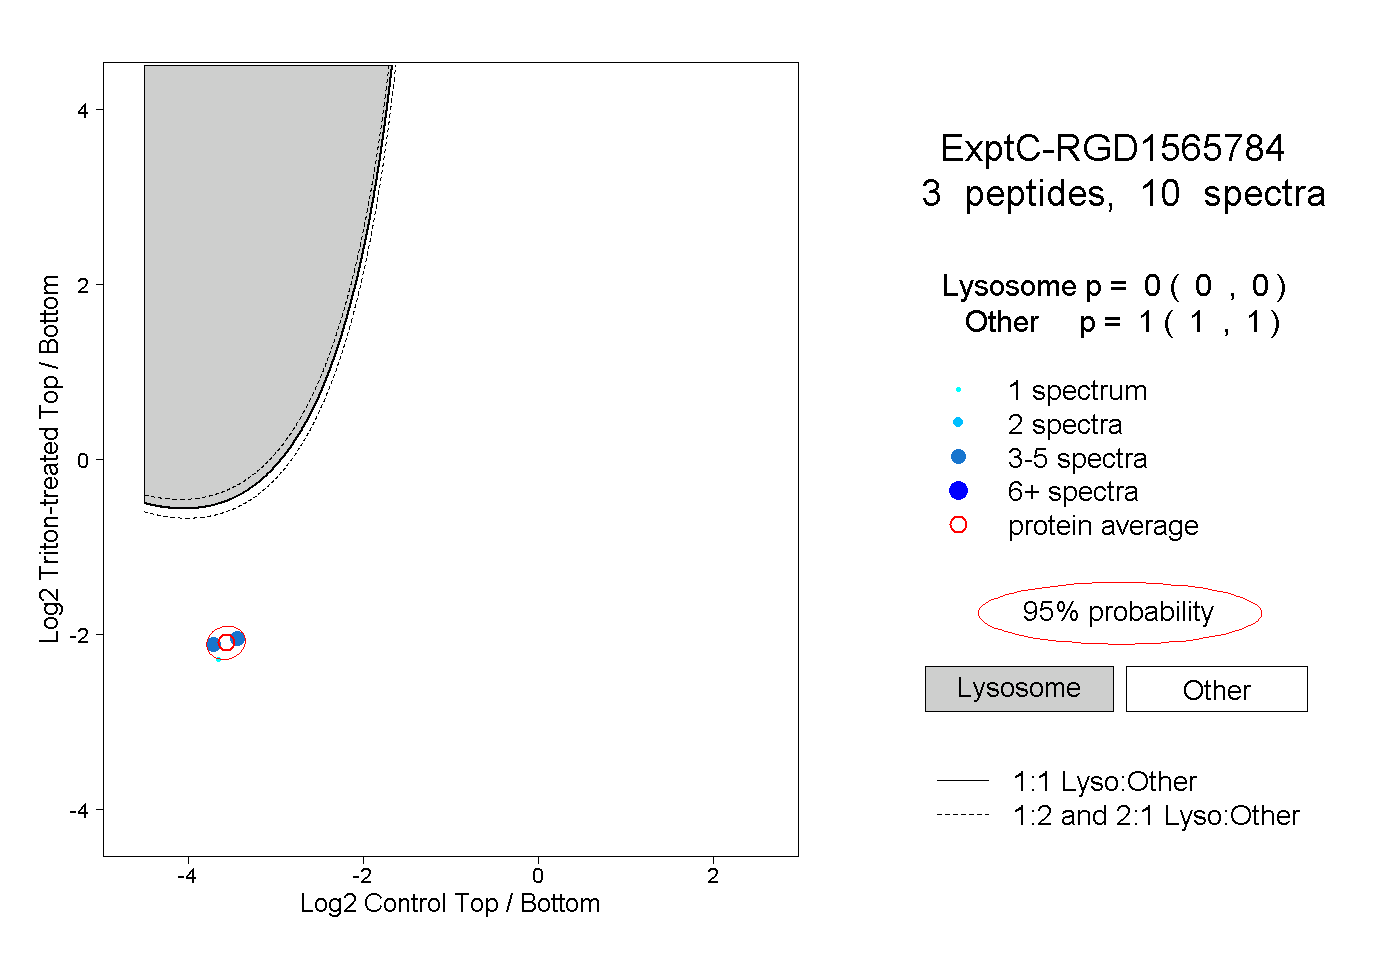
0.000 | 0.000
1.000 | 1.000
1peptide
spectrum
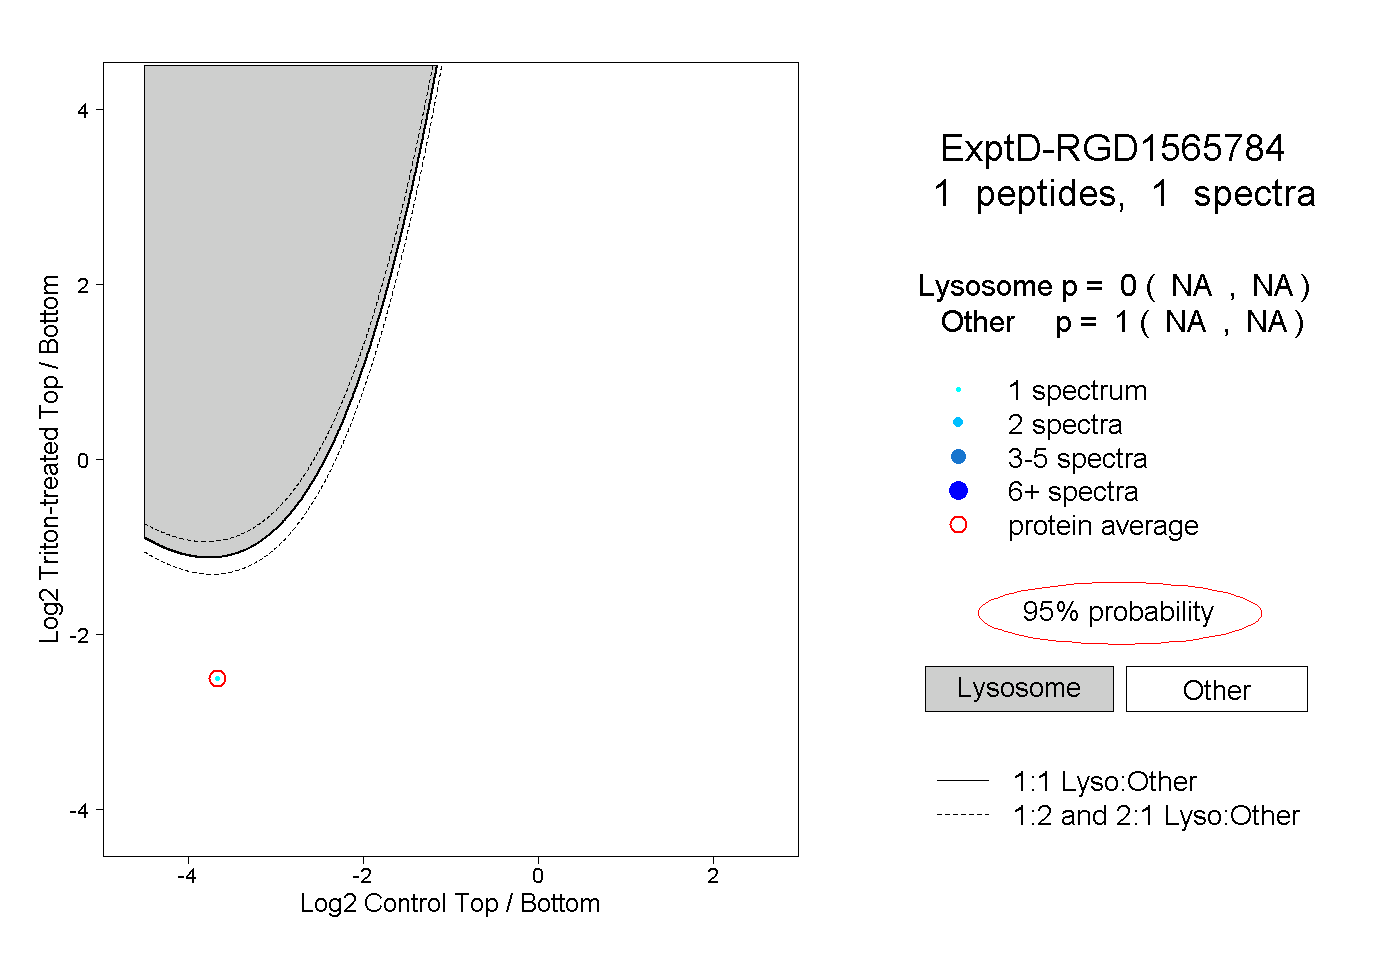
NA | NA
NA | NA