 2
2peptides
spectra
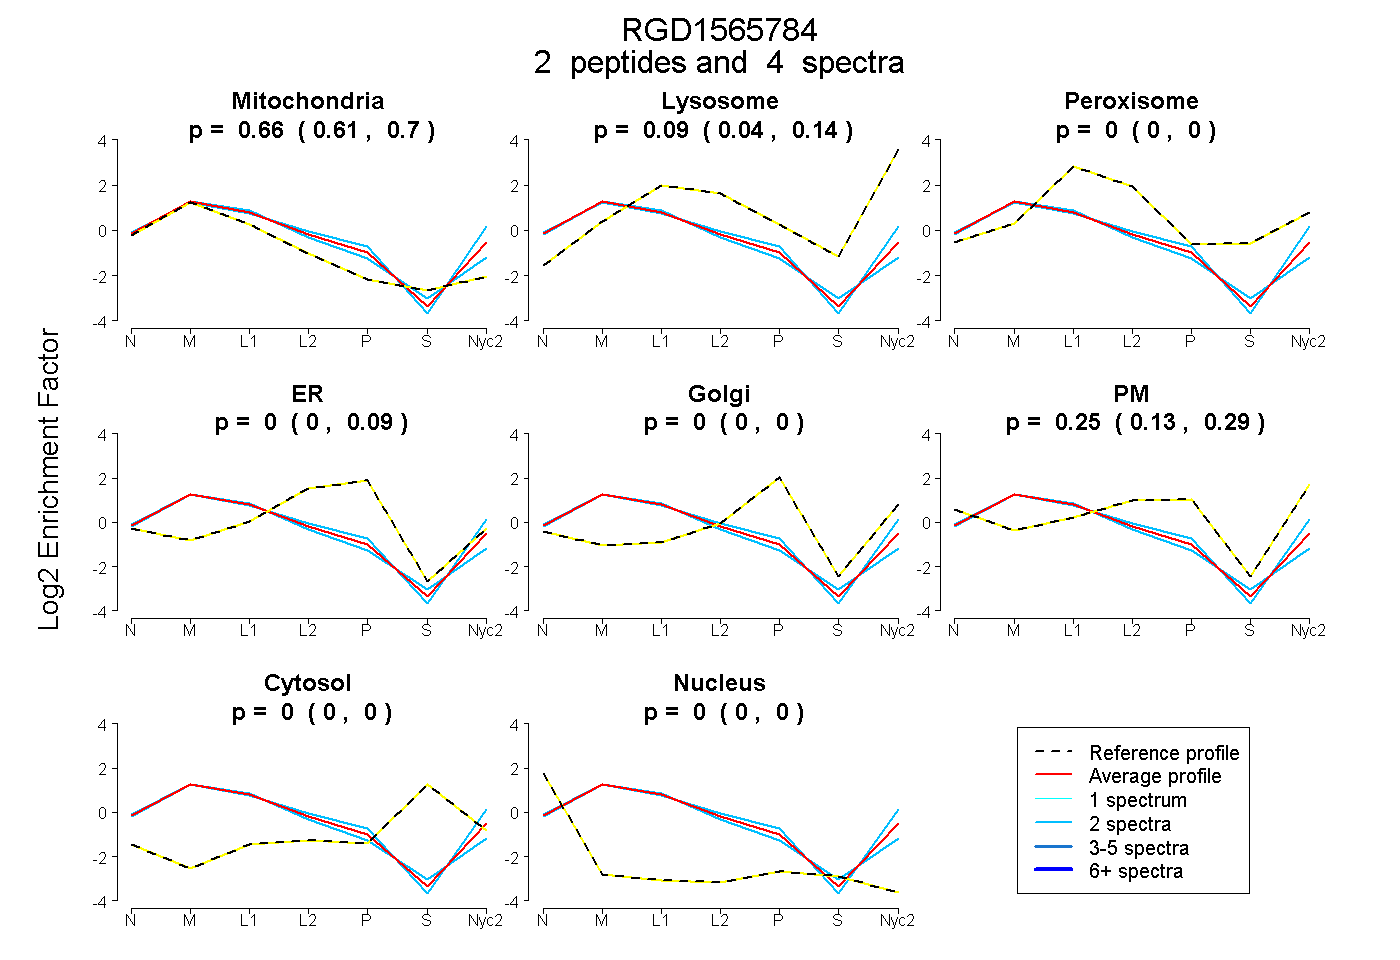
0.606 | 0.698
0.037 | 0.142
0.000 | 0.000
0.000 | 0.088
0.000 | 0.000
0.131 | 0.290
0.000 | 0.000
0.000 | 0.000
| Plot | Mito | Lyso | Perox | ER | Golgi | PM | Cytosol | Nucleus | |||||
| Expt A |
2 peptides |
4 spectra |
|
0.658 0.606 | 0.698 |
0.089 0.037 | 0.142 |
0.000 0.000 | 0.000 |
0.000 0.000 | 0.088 |
0.000 0.000 | 0.000 |
0.253 0.131 | 0.290 |
0.000 0.000 | 0.000 |
0.000 0.000 | 0.000 |
| 2 spectra, WTVEHSLGK | 0.545 | 0.101 | 0.000 | 0.000 | 0.000 | 0.354 | 0.000 | 0.000 | ||
| 2 spectra, QQQRPWWK | 0.750 | 0.059 | 0.042 | 0.077 | 0.000 | 0.073 | 0.000 | 0.000 |
| Plot | Lyso | Other | |||||||||||
| Expt C |
3 peptides |
10 spectra |
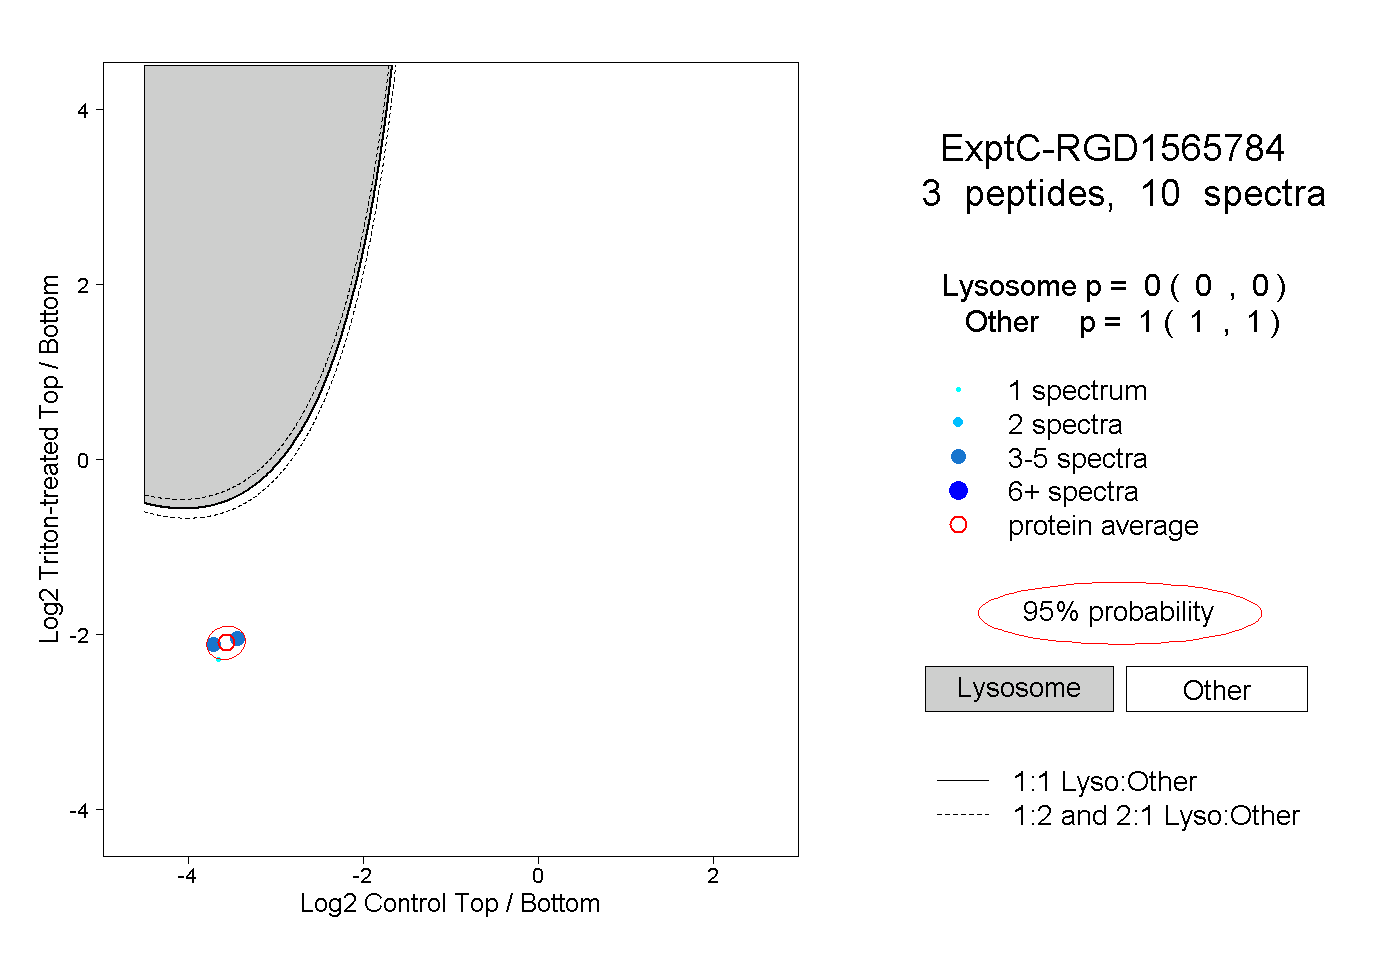 |
0.000 0.000 | 0.000 |
1.000 1.000 | 1.000 |
||||||||
| Plot | Lyso | Other | |||||||||||
| Expt D |
1 peptide |
1 spectrum |
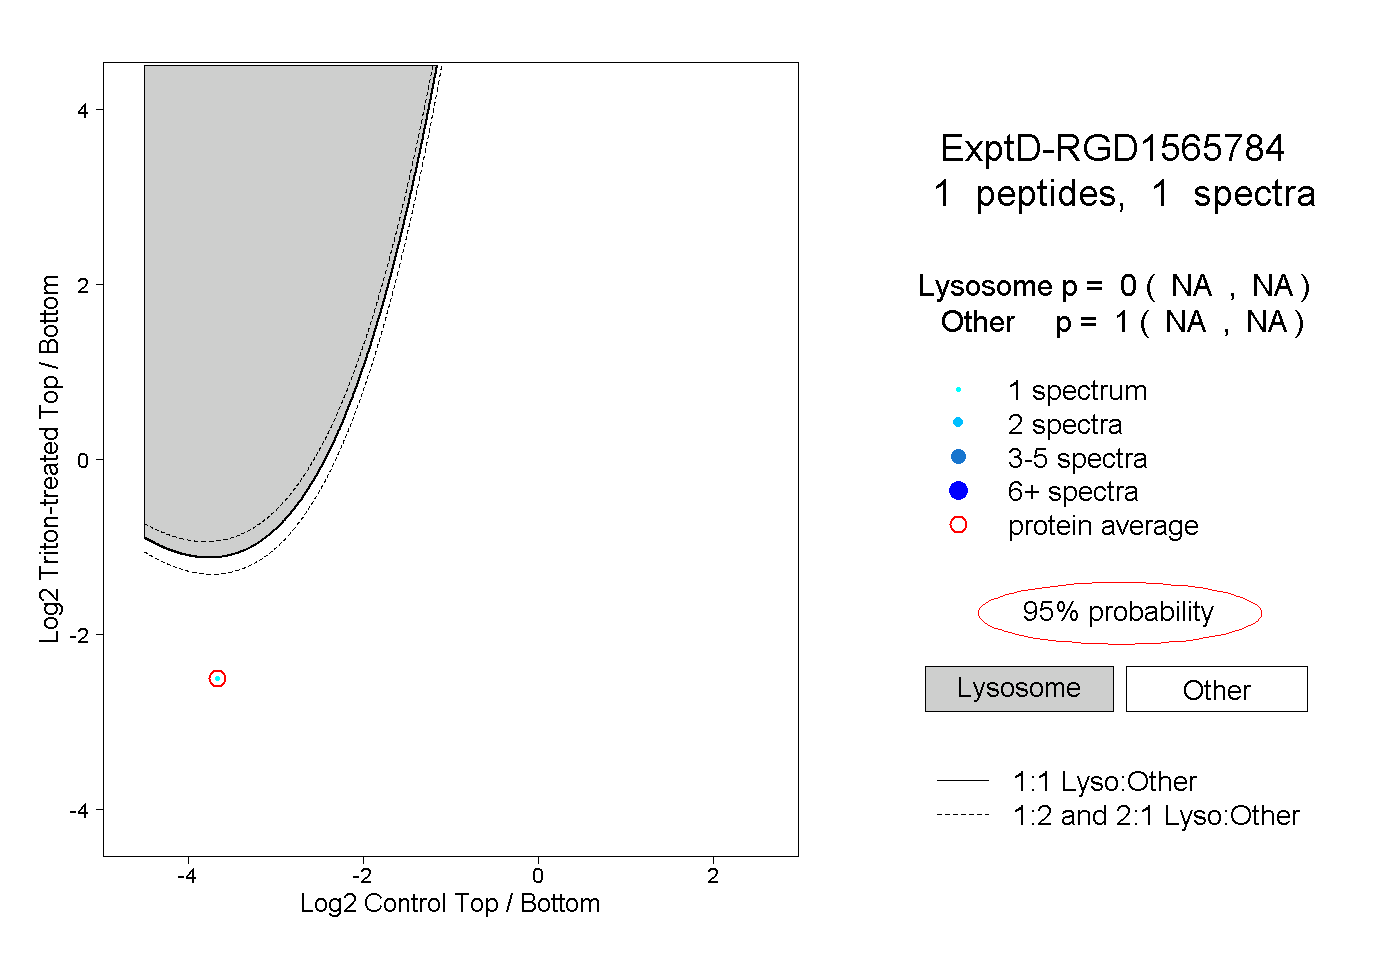 |
0.000 NA | NA |
1.000 NA | NA |