 4
4peptides
spectra
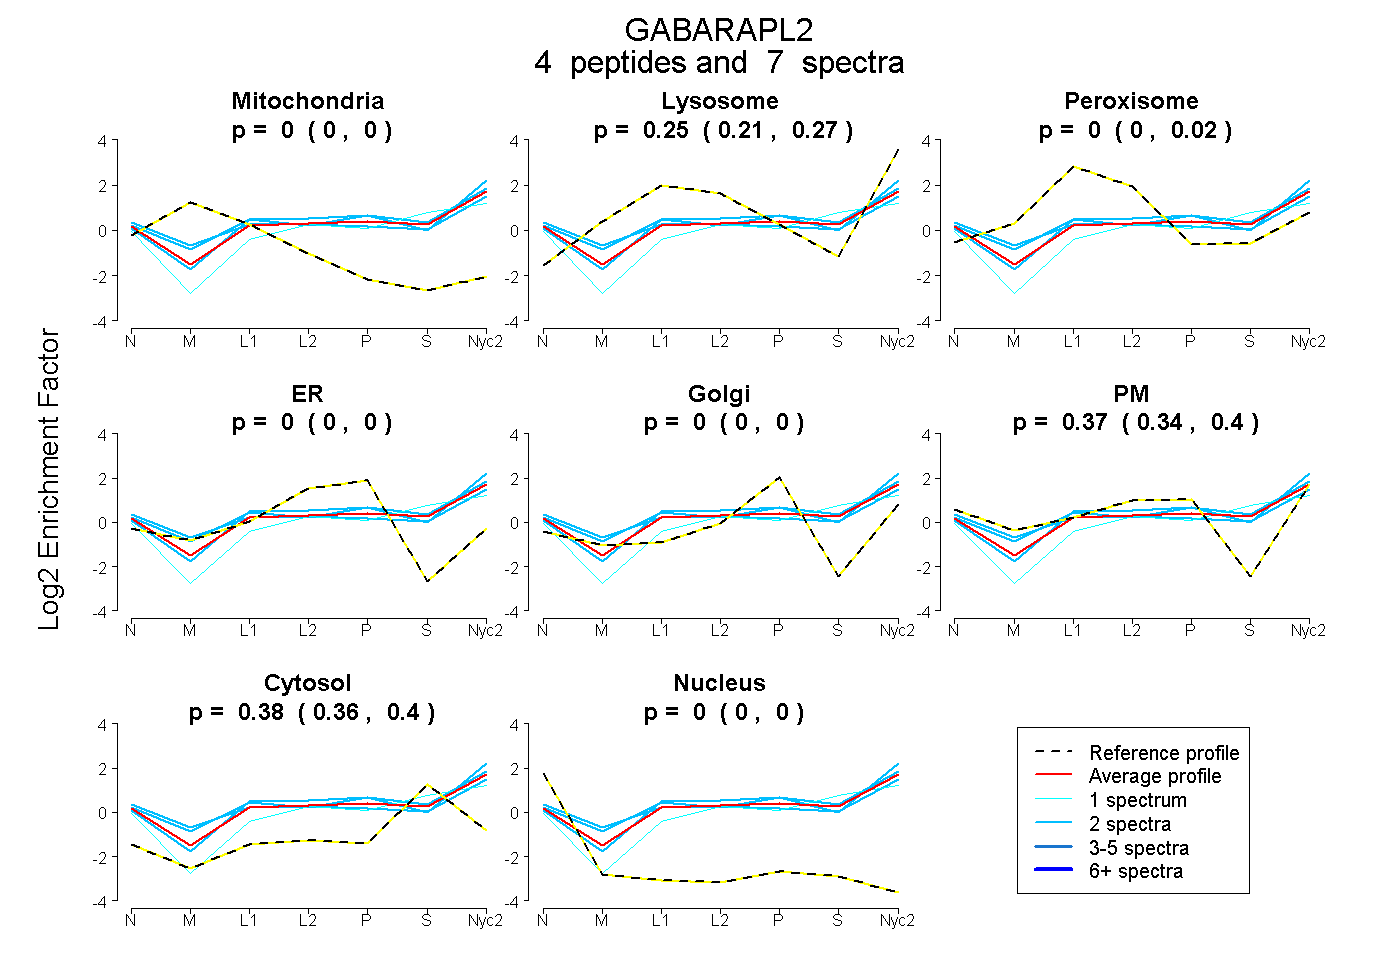
0.000 | 0.000
0.205 | 0.274
0.000 | 0.018
0.000 | 0.000
0.000 | 0.000
0.336 | 0.395
0.360 | 0.404
0.000 | 0.000
2peptides
spectra
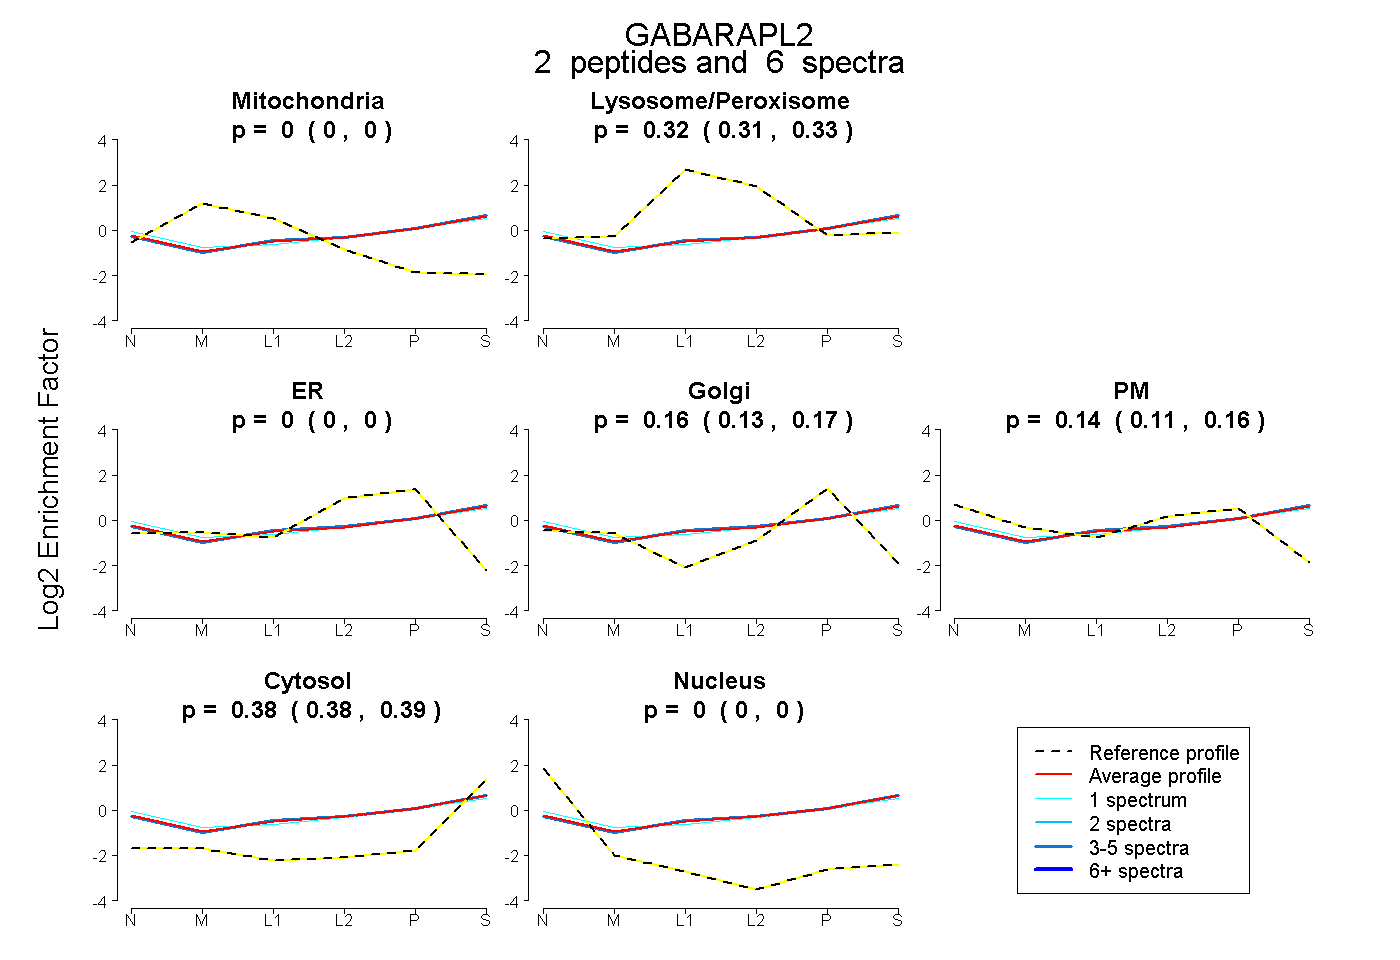
0.000 | 0.000
0.314 | 0.332
0.000 | 0.000
0.135 | 0.172
0.110 | 0.160
0.378 | 0.390
0.000 | 0.000
4peptides
spectra
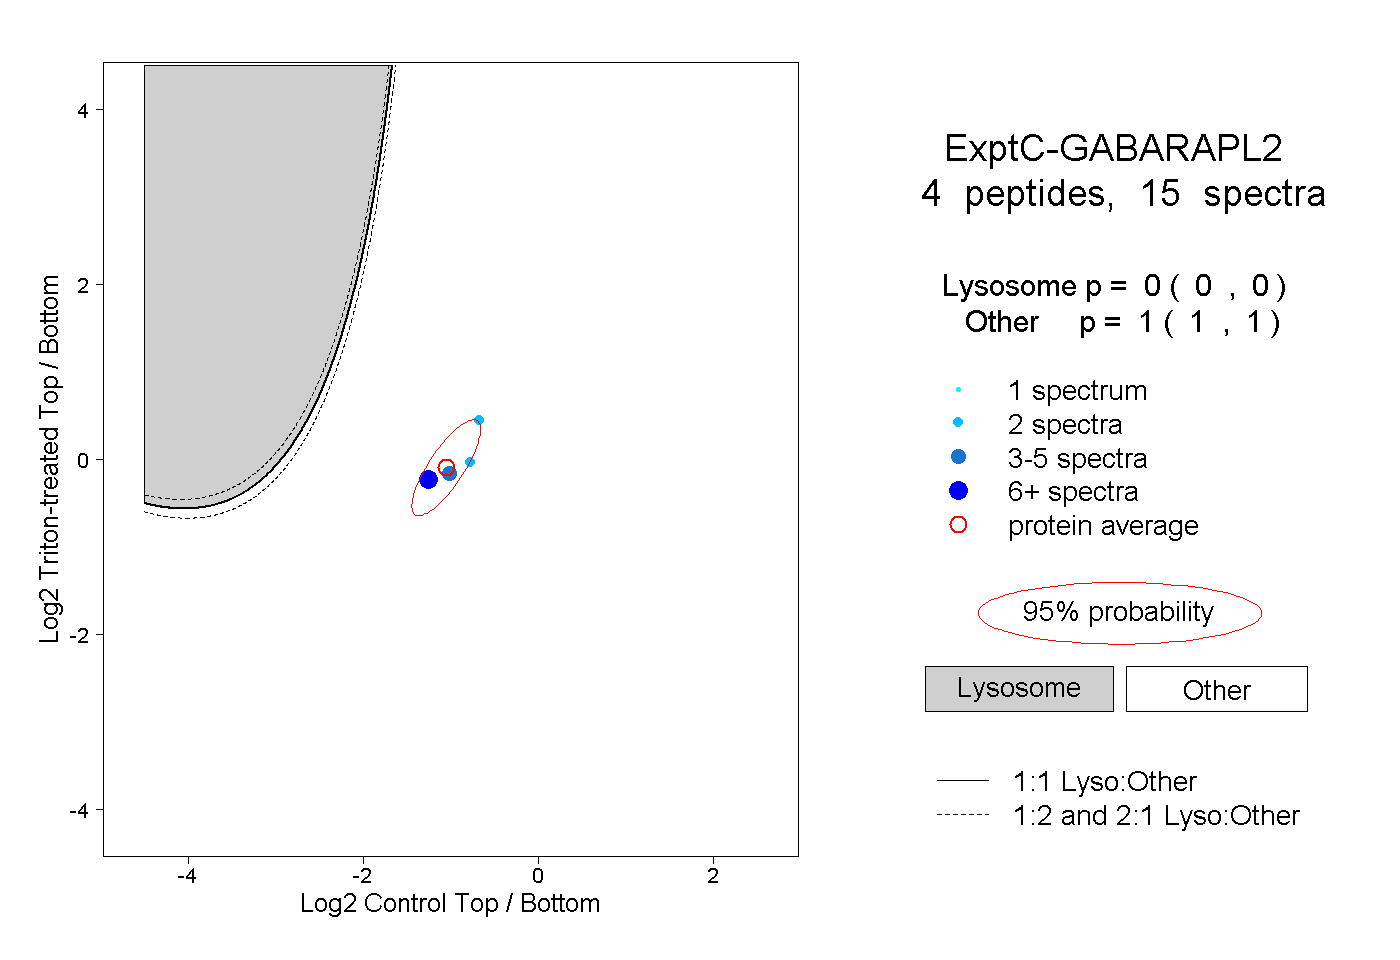
0.000 | 0.000
1.000 | 1.000